

Image: Why do not clouds fall?
The abysmal track record of computer models in simulating climate trends has increasingly been highlighted in the scientific literature. Recently published papers indicate that in some cases climate models actually get it right zero percent of the time (Luo et al., 2018; Hanna et al., 2018), or that hydrological models are wrong by a factor of 8 and 4 of 5 simulate trends opposite to real-world observations (Scanlon et al., 2018).
Even the model-based assumption that positive water vapor feedback accompanies and amplifies CO2-forced temperature change is not supported by observations, with CO2 climate sensitivity overestimated by 200% (Ollila, 2018). Simply put, climate modeling is increasingly being recognized in the scientific literature as lacking scientific merit.
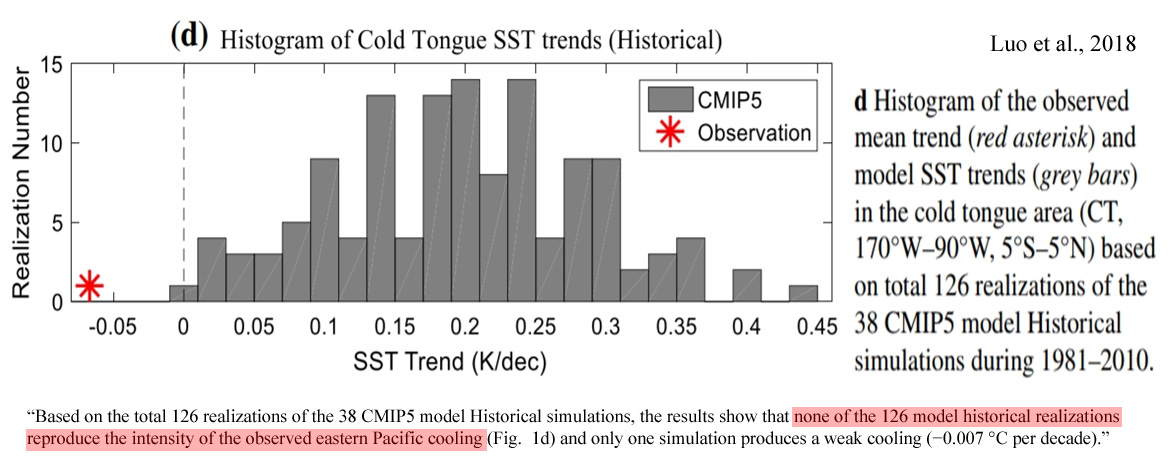
ZERO Of The 126 Models Reproduce Recent Pacific Ocean Cooling
“Over the recent three decades sea surface temperate (SST) in the eastern equatorial Pacific has decreased, which helps reduce the rate of global warming. However, most CMIP5 model simulations with historical radiative forcing do not reproduce this Pacific La Niña-like cooling. Based on the assumption of “perfect” models, previous studies have suggested that errors in simulated internal climate variations and/or external radiative forcing may cause the discrepancy between the multi-model simulations and the observation…. Based on the total 126 realizations of the 38 CMIP5 model Historical simulations, the results show that none of the 126 model historical realizations reproduce the intensity of the observed eastern Pacific [1981-2010] cooling and only one simulation produces a weak cooling (−0.007 °C per decade).”
ZERO Of 36 Models Capture Greenland’s Recent Blocking/Climatological Changes
Recent changes in summer Greenland blocking captured by none of the CMIP5 models
“Recent studies note a significant increase in high-pressure blocking over the Greenland region (Greenland Blocking Index, GBI) in summer since the 1990s. … We find that the recent summer GBI increase lies well outside the range of modelled past reconstructions (Historical scenario) and future GBI projections (RCP4.5 and RCP8.5). The models consistently project a future decrease in GBI (linked to an increase in NAO), which highlights a likely key deficiency of current climate models if the recently-observed circulation changes continue to persist. Given well-established connections between atmospheric pressure over the Greenland region and air temperature and precipitation extremes downstream, e.g. over Northwest Europe, this brings into question the accuracy of simulated North Atlantic jet stream changes and resulting climatological anomalies […] as well as of future projections of GrIS mass balance produced using global and regional climate models.”
IPCC’s CO2 Climate Forcing Values 200% ‘Too Sensitive’, Water Vapor Feedback ‘Does Not Exist’
Ollila, 2018
“The temperature effects of the water and CO2 are based on spectral analysis calculations, which show that water is 11.8 times stronger a GH gas than CO2 in the present climate. … There are essential features in the long-term trends of temperature and TPW [total precipitable water], which are calculated and depicted as mean values 11 years running. The temperature has increased about 0.4°C since 1979 and has now paused at this level. The long-term trend of TPW [total precipitable water] effects shows that it has slightly decreased during the temperature-increasing period from 1979 to 2000. This means that the absolute water amount in the atmosphere does not follow the temperature increase, but is practically constant, reacting only very slightly to the long-term trends of temperature changes. The assumption that relative humidity is constant and that it amplifies the GH gas changes over the longer periods by doubling the warming effects finds no grounds based on the behavior of the TWP [total precipitable water] trend. The positive water feedback exists only during the short-term ENSO events (≤4 years).”
“The validity of the IPCC model can be tested against the observed temperature. It turns out that the IPCC-calculated temperature increase for 2016 is 1.27°C, which is 49 per cent higher than the observed 0.85°C. This validity test means that the IPCC climate forcing model using the radiative forcing value of CO2 is too sensitive for CO2 increase, and the CS [climate sensitivity] parameter, including the positive water feedback doubling the GH gas effects, does not exist.”
“The CO2 emissions from 2000 onward represent about one-third of the total emissions since 1750, but the temperature has not increased, and it has paused at the present level. This is worthy proof that the IPCC’s climate model has overestimated human-induced causes and has probably underestimated natural causes like the sun’s activity changes, considering the historical temperatures during the past 2000 years.”
“The RF [radiative forcing] value for the CO2 concentration of 560 ppm is 2.16 Wm−2 according to equation (3), which is 42 per cent smaller than 3.7 Wm−2 used by the IPCC. The same study of Ollila (2014) shows that the CS [climate sensitivity] parameter λ is 0.27 K/(Wm−2), which means that there is no water feedback. Using this λ value, equation (3) gives a TCS [transient climate sensitivity] value of 0.6°C only. This same result is also reported by Harde (2014) using the spectral analysis method. …There are both theoretical- and measurement-based studies showing results that can be explained only by the fact that there is no positive water feedback. This result reduces the CS [climate sensitivity] by 50 per cent. Some research studies show that the RF [radiative forcing] value of carbon dioxide is considerably smaller than the commonly used RF value, according to the equation of Myhre et al. (1998). Because of these two causes, the critical studies show a TCS [transient climate sensitivity] of about 0.6°C instead of 1.9°C by the IPCC, a 200 per cent difference.”
Observations Have ‘Factor Of Two’ Less Warming Than Modeled Projections
Christy et al., 2018
“All datasets produce high correlations of anomalies versus independent observations from radiosondes (balloons), but differ somewhat in the metric of most interest, the linear trend beginning in 1979. The trend is an indicator of the response of the climate system to rising greenhouse gas concentrations and other forcings, and so is critical to understanding the climate. The satellite results indicate a range of near-global (+0.07 to +0.13°C decade−1) […] trends (1979–2016), and suggestions are presented to account for these differences. We show evidence that MSUs on National Oceanic and Atmospheric Administration’s satellites (NOAA-12 and −14, 1990–2001+) contain spurious warming, especially noticeable in three of the four satellite datasets.”
“Comparisons with radiosonde datasets independently adjusted for inhomogeneities and Reanalyses suggest the actual tropical (20°S-20°N) trend is +0.10 ± 0.03°C decade−1. This tropical result is over a factor of two less than the trend projected from the average of the IPCC climate model simulations for this same period (+0.27°C decade−1). … Because the model trends are on average highly significantly more positive and with a pattern in which their warmest feature appears in the latent-heat release region of the atmosphere, we would hypothesize that a misrepresentation of the basic model physics of the tropical hydrologic cycle (i.e. water vapour, precipitation physics and cloud feedbacks) is a likely candidate.”
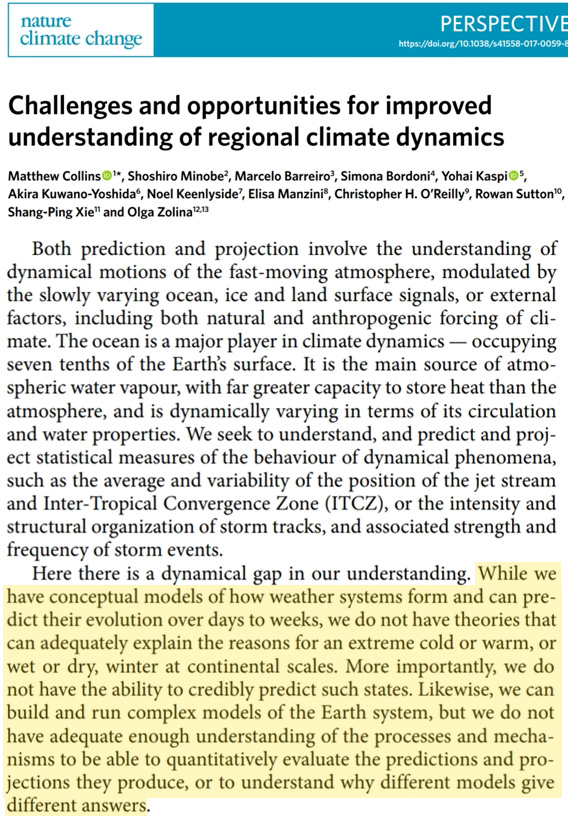
Climate Models Are Conceptual And We Don’t Understand The Mechanisms
Collins et al., 2018
“Here there is a dynamical gap in our understanding. While we have conceptual models of how weather systems form and can predict their evolution over days to weeks, we do not have theories that can adequately explain the reasons for an extreme cold or warm, or wet or dry, winter at continental scales. More importantly, we do not have the ability to credibly predict such states. Likewise, we can build and run complex models of the Earth system, but we do not have adequate enough understanding of the processes and mechanisms to be able to quantitatively evaluate the predictions and projections they produce, or to understand why different models give different answers. … The global warming ‘hiatus’ provides an example of a climate event potentially related to inter-basin teleconnections. While decadal climate variations are expected, the magnitude of the recent event was unforeseen. A decadal period of intensified trade winds in the Pacific and cooler sea surface temperatures (SSTs) has been identified as a leading candidate mechanism for the global slowdown in warming.”
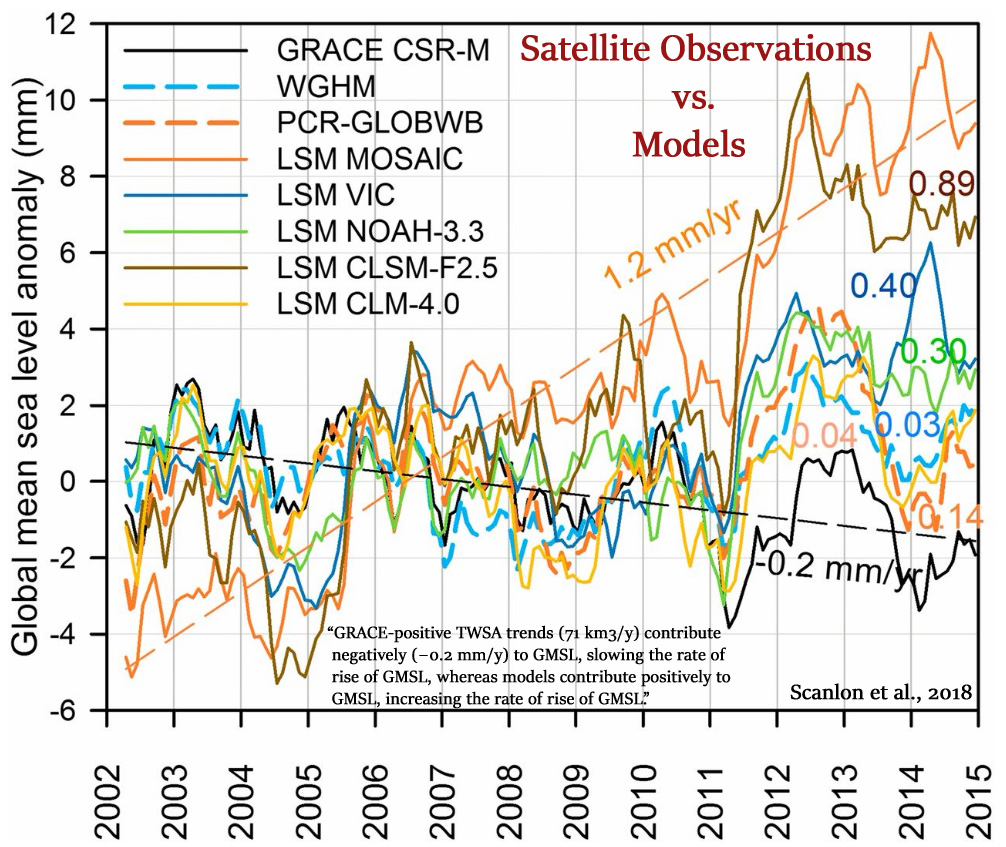
Hydrological Modeling Off By A Factor Of 8, With 4 Of 5 M0dels Yielding Opposite Trends Vs. Observations
Scanlon et al., 2018
“The models underestimate the large decadal (2002–2014) trends in water storage relative to GRACE satellites, both decreasing trends related to human intervention and climate and increasing trends related primarily to climate variations. The poor agreement between models and GRACE underscores the challenges remaining for global models to capture human or climate impacts on global water storage trends. … Increasing TWSA [total water storage anomalies] trends are found primarily in nonirrigated basins, mostly in humid regions, and may be related to climate variations. Models also underestimate median GRACE increasing trends(1.6–2.1 km3/y) by up to a factor of ∼8 in GHWRMs [global hydrological and water resource models] (0.3–0.6 km3/y). Underestimation of GRACE-derived TWSA increasing trends is much greater for LSMs [global land surface models], with four of the five LSMs [global land surface models] yielding opposite trends (i.e., median negative rather than positive trends).”
“Increasing GRACE trends are also found in surrounding basins, with most models yielding negative trends. Models greatly underestimate the increasing trends in Africa, particularly in southern Africa. .. TWSA trends from GRACE in northeast Asia are generally increasing, but many models show decreasing trends, particularly in the Yenisei. … Subtracting the modeled human intervention contribution from the total land water storage contribution from GRACE results in an estimated climate-driven contribution of −0.44 to −0.38 mm/y. Therefore, the magnitude of the estimated climate contribution to GMSL [global mean sea level] is twice that of the human contribution and opposite in sign. While many previous studies emphasize the large contribution of human intervention to GMSL [global mean sea level], it has been more than counteracted by climate-driven storage increase on land over the past decade.”
“GRACE-positive TWSA trends (71 km3/y) contribute negatively (−0.2 mm/y) to GMSL, slowing the rate of rise of GMSL, whereas models contribute positively to GMSL, increasing the rate of rise of GMSL“
Ref.: http://notrickszone.com/2018/05/17/6-new-papers-climate-models-are-literally-worth-zero-even-water-vapor-feedback-does-not-exist/#sthash.7vfOCp9t.dpbs
…
Why do the models fail?
Don’t Tell Anyone, But We Just Had Two Years Of Record-Breaking Global Cooling
The drop in temperatures at least merits a “Hey, what’s going on here?” story.
Inconvenient Science: NASA data show that global temperatures dropped sharply over the past two years. Not that you’d know it, since that wasn’t deemed news. Does that make NASA a global warming denier?
Writing in Real Clear Markets, Aaron Brown looked at the official NASA global temperature data and noticed something surprising. From February 2016 to February 2018, “global average temperatures dropped by 0.56 degrees Celsius.” That, he notes, is the biggest two-year drop in the past century.
“The 2016-2018 Big Chill,” he writes,“was composed of two Little Chills, the biggest five month drop ever (February to June 2016) and the fourth biggest (February to June 2017). A similar event from February to June 2018 would bring global average temperatures below the 1980s average.”
Isn’t this just the sort of man-bites-dog story that the mainstream media always says is newsworthy?
In this case, it didn’t warrant any news coverage.
In fact, in the three weeks since Real Clear Markets ran Brown’s story, no other news outlet picked up on it. They did, however, find time to report on such things as tourism’s impact on climate change, how global warming will generate more hurricanes this year, and threaten fish habitats, and make islands uninhabitable. They wrote about a UN official saying that “our window of time for addressing climate change is closing very quickly.”
Reporters even found time to cover a group that says they want to carve President Trump’s face into a glacier to prove climate change “is happening.”
In other words, the mainstream news covered stories that repeated what climate change advocates have been saying ad nauseam for decades.
That’s not to say that a two-year stretch of cooling means that global warming is a hoax. Two years out of hundreds or thousands doesn’t necessarily mean anything. And there could be a reasonable explanation. But the drop in temperatures at least merits a “Hey, what’s going on here?” story.
What’s more, journalists are perfectly willing to jump on any individual weather anomaly — or even a picture of a starving polar bear — as proof of global warming. (We haven’t seen any stories pinning Hawaii’s recent volcanic activity on global warming yet, but won’t be surprised if someone tries to make the connection.)
We’ve noted this refusal to cover inconvenient scientific findings many times in this space over the years.
Hiding The Evidence
There was the study published in the American Meteorological Society’s Journal of Climate showing that climate models exaggerate global warming from CO2 emissions by as much as 45%. It was ignored.
Then there was the study in the journal Nature Geoscience that found that climate models were faulty, and that, as one of the authors put it, “We haven’t seen that rapid acceleration in warming after 2000 that we see in the models.”
Nor did the press see fit to report on findings from the University of Alabama-Huntsville showing that the Earth’s atmosphere appears to be less sensitive to changing CO2 levels than previously assumed.
How about the fact that the U.S. has cut CO2 emissions over the past 13 years faster than any other industrialized nation? Or that polar bear populations are increasing? Or that we haven’t seen any increase in violent weather in decades?
Crickets.
Reporters no doubt worry that covering such findings will only embolden “deniers” and undermine support for immediate, drastic action.
But if fears of catastrophic climate change are warranted — which we seriously doubt — ignoring things like the rapid cooling in the past two years carries an even bigger risk.
Full story here
Source for data: https://data.giss.nasa.gov/gistemp/tabledata_v3/GLB.Ts+dSST.txt
