Dams that supply Cape Town now up to 42% full

Picture: ISTOCK

The sustained winter rainfall has seen dam levels in the Western Cape continue to rise.

The average level for dams across the Western Cape for the week starting on Monday was 36.3%‚ compared to 22.8% for the same period last year.

Last week at this time the level was 31.5%. The dams feeding the City of Cape Town are now at 42.7%‚ compared to 24.2% in 2017.

This represents a rise of about 4.5 percentage points over the past week.

Dam levels to June 24

Picture: CITY OF CAPE TOWN

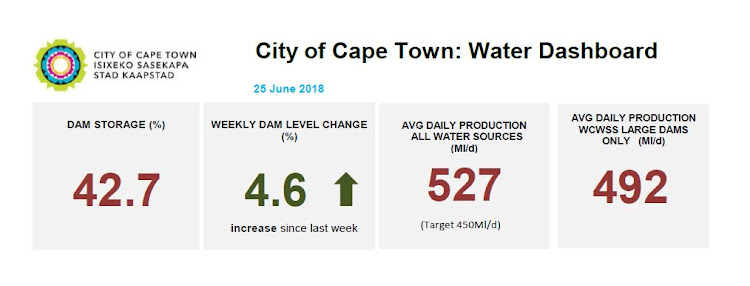
However‚ Western Cape minister of Local Government‚ Environmental Affairs and Development Planning Anton Bredell urged the public not to be complacent when it comes to water usage. “The drought is not over and the dams are still quite low‚ despite the very welcome relief and continued increases. We must continue to adhere to water restrictions and reduce water demand.

“The lower water usage patterns we’ve been seeing over the past year must be the new normal. Permanent behaviour change that is geared towards sustainable use of our limited resources must become the new norm‚” he said.

Rainfall and dam capacity levels to June 24

………….
Rain, rain (never) go away: See how Cape Town’s dam levels are rising
From March 2018 to June 2018 Theewaterskloof Dam has shown a remarkable change thanks to rains blessing the Western Cape. Here’s a comparison from the ground over the past three months.
….


Support

Newscats – on Patreon or Payoneer ID: 55968469

Cherry May Timbol – Independent Reporter
Contact Cherry at: cherrymtimbol@newscats.org or timbolcherrymay@gmail.com
Support Cherry May directly at: https://www.patreon.com/cherrymtimbol

Ad

Why do CO2 lag behind temperature?

71% of the earth is covered by ocean, water is a 1000 times denser than air and the mass of the oceans are 360 times that of the atmosphere, small temperature changes in the oceans doesn’t only modulate air temperature, but it also affect the CO2 level according to Henry’s Law.

The reason it is called “Law” is because it has been “proven”!

“.. scientific laws describe phenomena that the scientific community has found to be provably true ..”

That means, the graph proves CO2 do not control temperature, that again proves (Man Made) Global Warming, now called “Climate Change” due to lack of … Warming is – again – debunked!