

Senator Malcolm Roberts:
ON CLIMATE, CSIRO LACKS EMPIRICAL PROOF
H/t Jo Nova
Finally, a public airing of empirical flaws in consensus climate science. Senator Malcolm Roberts is doing Australia and the entire world a service is applying critical intelligence to IPCC climate science as espoused by CSIRO, Australia’s climate agency.
The scientific debate between Roberts et al. and CSIRO is documented in depth for all to peruse at Climate Change – One Nation’s response to CSIRO (here).
Overview:
Senator Malcolm Roberts in his maiden speech asserted that CSIRO had no empirical evidence that human emissions of CO2 caused any significant global warming. A meeting was arranged between CSIRO and Senator Roberts’ staff where CSIRO presented their empirical evidence. The linked document is a detailed review of that empirical evidence and has raised many questions, as well as indicating some points of agreement.
Excerpts below with images suggest that finally we have an intensive and worthwhile debate about the state of climate science, and a reasonable assessment of uncertainties in our present levels of human understanding of climate operations. Statements and images below are only examples of the extensive commentary and numerous exhibits provided.
CSIRO: Carbon dioxide is a greenhouse gas.
The natural greenhouse effect makes the planet habitable: the average temperature of the earth is 33°C warmer than it would be in the absence of greenhouse gases.
The laws of physics and direct measurements confirm that carbon dioxide is a greenhouse gas.
Roberts: Accepted that CO2 is a Greenhouse Gas if that just means it absorbs long wave infra-red radiation.
We will not contest the use of the term greenhouse effect but are unaware of any evidence that the atmosphere behaves similarly to a physical greenhouse. Some reasons for our hesitation follow.
The Greenhouse effect, as a product of back radiation heating against the thermal gradient and in violation of Fourier’s Law, is yet to be confirmed by explicitly relevant and controlled experiment.
CSIRO: Carbon dioxide concentrations in the atmosphere have increased.
Atmospheric carbon dioxide levels have increased by more than 40% since pre-industrial times
Roberts: Accepted that CO2 levels have risen since 1800 but this benefits plants and animals.

Annual atmospheric CO2 background level from 1856 to 2008 compared to SST (Kaplan, KNMI); red line, CO2 MBL reconstruction from 1826 to 1959 (Beck 2010); CO2 1960-2008: (Mauna Loa); blue line, annual SST (Kaplan) from 1856 -2003; SST= sea surface temperature

Increase in dry weight of major crop plants when atmospheric CO2 concentrations are raised. The data presented is based on large numbers of scientific studies.
CSIRO: The extra carbon dioxide in the atmosphere comes from human activities.
CO2 in the atmosphere has increased as human emissions have increased (the two are correlated).

Roberts: It is accepted that much of the recent extra CO2 probably comes from human activities but the CSIRO evidence does not seem to support the implied certainty.

These estimates of CO2 sinks are not empirical evidence and will more likely be revised as more data comes in from the Orbiting Carbon Observatory 2 satellite system

Deriving an average CO2 concentration for the whole world may be as controversial as the temperature average.
CSIRO: The additional carbon dioxide added to the atmosphere by human activities has enhanced the greenhouse effect: less energy is leaving the top of the atmosphere in the wavelengths absorbed by carbon dioxide and other greenhouse gases.

Roberts: The evidence provided doesn’t seem to support the stated conclusion.
The IRIS instrument was 1970 and the IMG instrument 1997. There is only the slightest change in methane and no significant change in CO2. [link]. This would seem be be empirical evidence that CO2 has no effect on brightness temperature.

Decadal variations in atmospheric water vapor.
Even a two percent variation in atmospheric water vapor will equal the total amount of supposed greenhouse effect of all human CO2 production.
CSIRO: The earth has warmed.
Graph: Global Surface temperature vs Time 1900 – 2015 increasing 1°C per century

Roberts: independent replication of experiment, observation and analysis is a vital part of the scientific method.
Maximum temperature is generally considered a better measure of regional temp variability and this allows better comparison with the following graph.

A trend of 0.44°C per century is indicated.
The reanalysis tried to be free of arbitrary adjustments and the trend per century was reduced from 0.88°C to 0.44°C. The methodology of the reanalysis is explained in the attachment to this point.
CSIRO Graph: Ocean Heat Content increasing since 1975

Roberts: Accepted that the earth has warmed since the Little Ice Age but is still cooler than the Roman Warm Period and much cooler than the Holocene Thermal Maximum.
Pacific Ocean Heat Content is at the lowest for 8,000 years

We show that water masses linked to North Pacific and Antarctic intermediate waters were warmer by 2.1°C and 1.5°C, respectively, during the middle Holocene Thermal Maximum than over the past century. Both water masses were ~0.9°C warmer during the Medieval Warm period than during the Little Ice Age and ~0.65° warmer than in recent decades.”
CSIRO: Observed changes in the climate system are consistent with an enhanced greenhouse effect. Other forcings (e.g. volcanoes, the sun, internal variability) cannot explain the magnitude, timing and distribution of observed trends.
Roberts: While there is strong correlation between CO2 and temperature when looking at the four last ice ages, CO2 does not appear to lead temperature. Looking at shorter timescales the correlation disappears and in the short satellite age data there appears to be no correlation with any greenhouse effect, enhanced or otherwise.
CO2 and temperature swings post 1850 show some correlation and some divergence

CO2 and temperature swings in the satellite age show little short term correlation


CSIRO: Models can reproduce the record of global averaged temperature if we include the effects of increased greenhouse gas forcing, but cannot do so with natural forcings alone.

Roberts: It is the model predictions that seem to be inconsistent with the observed changes which rather disqualifies the models as a basis for expensive action.
Only the Russian model INM-CM4.0 can approximately reproduce the record of global averaged temperatures since 1977.

Summary — On the topic of dangerous warming from fossil fuel emissions
MR: Well, Greg Hunt – and I’m looking at Alex here, not for an explanation but just to emphasise that Greg Hunt in particular has said that his climate policies rely entirely on the CSIRO, the Bureau of Meteorology and the IPCC. And so he’s saying, we will end up in danger unless we do something to cut the use of hydrocarbon fuels. And so, if he relies upon the CSIRO’s advice, is that where he’s getting his imminent danger from?
CSIRO said that the interpretation of danger is up to the Australian public, and the Minister
MR: So, the Minister has drawn those conclusions. ….. independent of the CSIRO. You’ve presented him with the temperature changes and the causal analysis and he’s gone: Oh my God, we’ve got to do something.
CSIRO said it’s probably best to ask the Minister if he’s done that.
MR: Okay.
Ministerial Adviser indicated that the Minister would be happy to have a conversation about that and advised that’s definitely a conversation for the Minister not for the CSIRO.
MR: Sure. Okay. So, the CSIRO just presents the data and leaves the policy decisions to the Ministers?
CSIRO confirmed that is correct.
Source: https://rclutz.wordpress.com/2016/11/07/climate-debate-is-on/
Comment:
How come the graph start in 1910?
.. because, if they were to use data from before 1910 they would ruin their case, their global warming swindle
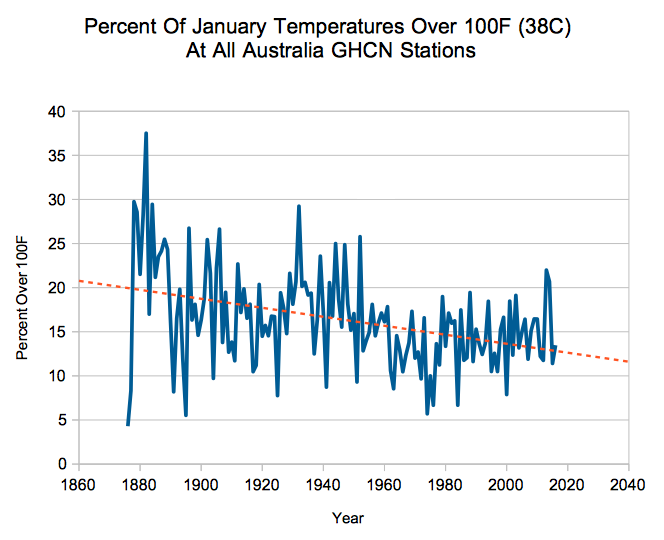
Ref.: http://realclimatescience.com/2016/10/frequency-of-hot-days-in-australia-plummeting/
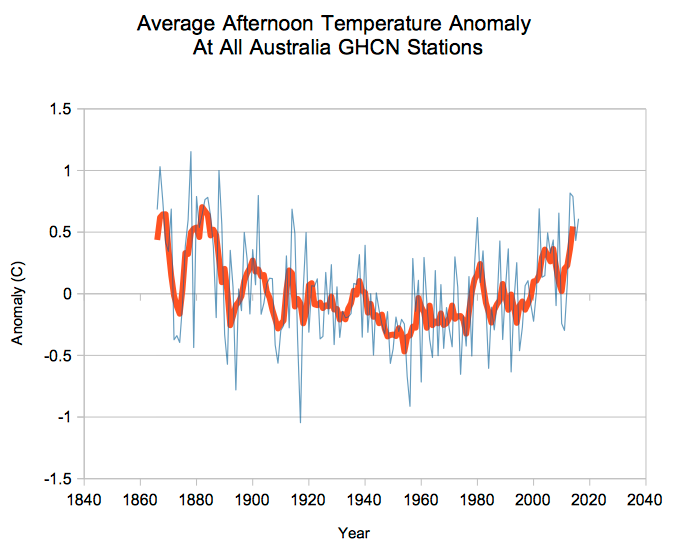
Ref.: http://realclimatescience.com/2016/09/afternoon-temperatures-in-australia-peaked-in-1878/
There is nothing special going on when it comes to the climate. The only thing special is the dishonest, “green” criminals wanting their kleptomaniac fat and greasy sausage fingers deeper in your pocket to scrape out more tax revenue to finance their socialist (no good), feel-good BS politics and to finance their globalist, corrupt friends.
