

Updated: The Shrinking CO2 Climate Sensitivity
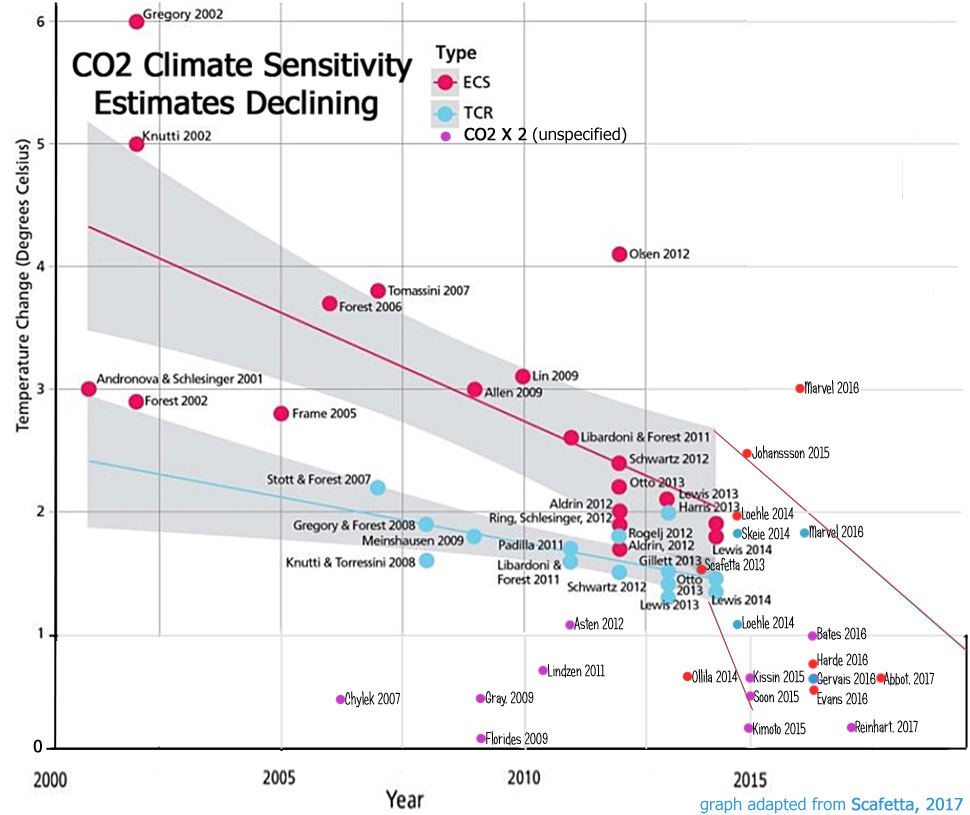
A recently highlighted paper published by atmospheric scientists Scafetta et al., (2017) featured a graph (above) documenting post-2000 trends in the published estimates of the Earth’s climate sensitivity to a doubling of CO2 concentrations (from 280 parts per million to 560 ppm).
The trajectory for the published estimates of transient climate response (TCR, the average temperature response centered around the time of CO2 doubling) and equilibrium climate sensitivity (ECS, the temperature response upon reaching an equilibrium state after doubling) are shown to be declining from an average of about 3°C earlier in the century to below 2°C and edging towards 1°C for the more recent years.
This visual evidence would appear to indicate that past climate model determinations of very high climate sensitivity (4°C, 5°C, 6°C and up) have increasingly been determined to be in error. The anthropogenic influence on the Earth’s surface temperature has likely been significantly exaggerated.
Scafetta et al., 2017 “Since 2000 there has been a systematic tendency to find lower climate sensitivity values. The most recent studies suggest a transient climate response (TCR) of about 1.0 °C, an ECS less than 2.0 °C and an effective climate sensitivity (EfCS) in the neighborhood of 1.0 °C.”
“Thus, all evidences suggest that the IPCC GCMs at least increase twofold or even triple the real anthropogenic warming. The GHG theory might even require a deep re-examination.”
An Update On The Gradually Declining Climate Sensitivity
The graph shown in Scafetta et al. (2017) ends in 2014, which means that papers published in the last 3 years are not included. Also, there were several other published climate sensitivity papers from the last decade that were excluded from the analysis, possibly because they did not include and/or specify TCR and/or ECS estimates in isolation, but instead just used a generic doubled-CO2 climate sensitivity value (shown in purple here).
Below is a new, updated graph that (1) includes some of the previously unidentified papers and (2) adds the 10 – 12 climate sensitivity papers published in the last 3 years. Notice, again, that the trend found in published papers has continued downwards, gradually heading towards zero. The reference list for the over 20 additional papers used for the updated analysis is also included below.
Reinhart, 2017 (<0.24°C)
Our results permit to conclude that CO2 is a very weak greenhouse gas and cannot be accepted as the main driver of climate change. … The assumption of a constant temperature and black body radiation definitely violates reality and even the principles of thermodynamics. … [W]e conclude that the temperature increases predicted by the IPCC AR5 lack robust scientific justification. … A doubling [to 800 ppm] of the present level of CO2 [400 ppm] results in [temperature change] < 0.24 K. … [T]he scientific community must look for causes of climate change that can be solidly based on physics and chemistry. … The observed temperature increase since pre-industrial times is close to an order of magnitude higher than that attributable to CO2.
Abbot and Marohasy, 2017 (0.6°C equilibrium)
The largest deviation between the ANN [artificial neural network] projections and measured temperatures for six geographically distinct regions was approximately 0.2 °C, and from this an Equilibrium Climate Sensitivity (ECS) of approximately 0.6 °C [for a doubling of CO2 from 280 ppm to 560 ppm plus feedbacks] was estimated. This is considerably less than estimates from the General Circulation Models (GCMs) used by the Intergovernmental Panel on Climate Change (IPCC), and similar to estimates from spectroscopic methods.
The proxy measurements suggest New Zealand’s climate has fluctuated within a band of approximately 2°C since at least 900 AD, as shown in Figure 2. The warming of nearly 1°C since 1940 falls within this band. The discrepancy between the orange and blue lines in recent decades as shown in Figure 3, suggests that the anthropogenic contribution to this warming could be in the order of approximately 0.2°C. [80% of the warming since 1940 may be due natural factors].
Harde, 2016 (0.7°C equilibrium)
Including solar and cloud effects as well as all relevant feedback processes our simulations give an equilibrium climate sensitivity of CS = 0.7 °C (temperature increase at doubled CO2) and a solar sensitivity of SS = 0.17 °C (at 0.1 % increase of the total solar irradiance). Then CO2 contributes 40 % and the Sun 60 % to global warming over the last century.
Bates, 2016 (~1°C)
Estimates of 2xCO2 equilibrium climate sensitivity (EqCS) derive from running global climate models (GCMs) to equilibrium. Estimates of effective climate sensitivity (EfCS) are the corresponding quantities obtained using transient GCM output or observations. The EfCS approach uses an accompanying energy balance model (EBM), the zero-dimensional model (ZDM) being standard. GCM values of EqCS and EfCS vary widely [IPCC range: (1.5, 4.5)°C] and have failed to converge over the past 35 years. Recently, attempts have been made to refine the EfCS approach by using two-zone (tropical/extratropical) EBMs. When applied using satellite radiation data, these give low and tightly-constrained EfCS values, in the neighbourhood of 1°C. … The central conclusion of this study is that to disregard the low values of effective climate sensitivity (≈1°C) given by observations on the grounds that they do not agree with the larger values of equilibrium, or effective, climate sensitivity given by GCMs, while the GCMs themselves do not properly represent the observed value of the tropical radiative response coefficient, is a standpoint that needs to be reconsidered.
Evans, 2016 (<0.5°C equilibrium)
The conventional basic climate model applies “basic physics” to climate, estimating sensitivity to CO2. However, it has two serious architectural errors. It only allows feedbacks in response to surface warming, so it omits the driver-specific feedbacks. It treats extra-absorbed sunlight, which heats the surface and increases outgoing long-wave radiation (OLR), the same as extra CO2, which reduces OLR from carbon dioxide in the upper atmosphere but does not increase the total OLR. The rerouting feedback is proposed. An increasing CO2 concentration warms the upper troposphere, heating the water vapor emissions layer and some cloud tops, which emit more OLR and descend to lower and warmer altitudes. This feedback resolves the nonobservation of the “hotspot.” An alternative model is developed, whose architecture fixes the errors. By summing the (surface) warmings due to climate drivers, rather than their forcings, it allows driver-specific forcings and allows a separate CO2 response (the conventional model applies the same response, the solar response, to all forcings). It also applies a radiation balance, estimating OLR from properties of the emission layers. Fitting the climate data to the alternative model, we find that the equilibrium climate sensitivity is most likely less than 0.5°C, increasing CO2 most likely caused less than 20% of the global warming from the 1970s, and the CO2 response is less than one-third as strong as the solar response. The conventional model overestimates the potency of CO2 because it applies the strong solar response instead of the weak CO2response to the CO2 forcing.
Gervais, 2016 [full] (<0.6°C transient)
Conclusion: Dangerous anthropogenic warming is questioned (i) upon recognition of the large amplitude of the natural 60–year cyclic component and (ii) upon revision downwards of the transient climate response consistent with latest tendencies shown in Fig. 1, here found to be at most 0.6 °C once the natural component has been removed, consistent with latest infrared studies (Harde, 2014). Anthropogenic warming well below the potentially dangerous range were reported in older and recent studies (Idso, 1998; Miskolczi, 2007; Paltridge et al., 2009; Gerlich and Tscheuschner, 2009; Lindzen and Choi, 2009, 2011; Spencer and Braswell, 2010; Clark, 2010; Kramm and Dlugi, 2011; Lewis and Curry, 2014; Skeie et al., 2014; Lewis, 2015; Volokin and ReLlez, 2015). On inspection of a risk of anthropogenic warming thus toned down, a change of paradigm which highlights a benefit for mankind related to the increase of plant feeding and crops yields by enhanced CO2 photosynthesis is suggested.
Marvel et al., 2016 (1.8°C transient, 3.0°C equilibrium)
Assuming that all forcings have the same transient efficacy as greenhouse gases, and following a previous study, the best estimate (median) for TCR is 1.3°C. However, scaling each forcing by our estimates of transient efficacy (determined from either iRF or ERF), we obtain a best estimate for TCR of 1.8°C. This scaling simultaneously considers both forcing and ocean heat uptake efficacy. Other estimates of TCR which differ slightly due to choices of base period and uncertainty estimates and the aerosol forcing used, are similarly revised upward when using calculated efficacies. We apply the same reasoning to estimates of ECS. Using an estimate4 of the rate of recent heat uptake Q = 0.65 ± 0.27 W m-2, we find, assuming all equilibrium efficacies are unity, a best estimate of ECS = 2.0°C, comparable to the previous result of 1.9°C. However, as with TCR, accounting for differences in equilibrium forcing efficacy revises the estimate upward; our new best estimate (using efficacies derived from the iRF) is 2.9°C. If efficacies are instead calculated from the ERF, the best estimate of ECS is 3.0°C. As for TCR, alternate estimates of ECS are revised upward when efficacies are taken into account.
Soon, Connolly, and Connolly, 2015 [full] (0.44°C)
Nonetheless, let us ignore the negative relationship with greenhouse gas (GHG) radiative forcing, and assume the carbon dioxide (CO2) relationship is valid. If atmospheric carbon dioxide concentrations have risen by ~110 ppmv since 1881 (i.e., 290→400 ppmv), this would imply that carbon dioxide (CO2) is responsible for a warming of at most 0.0011 × 110 = 0.12°C over the 1881-2014 period, where 0.0011 is the slope of the line in Figure 29(a). We can use this relationship to calculate the so-called “climate sensitivity” to carbon dioxide, i.e., the temperature response to a doubling of atmospheric carbon dioxide. According to this model, if atmospheric carbon dioxide concentrations were to increase by ~400 ppmv, this would contribute to at most 0.0011 × 400 = 0.44°C warming. That is, the climate sensitivity to atmospheric carbon dioxide is at most 0.44°C.
Lewis and Curry, 2015 (1.33°C transient, 1.64°C equilibrium)
Energy budget estimates of equilibrium climate sensitivity (ECS) and transient climate response (TCR) are derived using the comprehensive 1750–2011 time series and the uncertainty ranges for forcing components provided in the Intergovernmental Panel on Climate Change Fifth Assessment Working Group I Report, along with its estimates of heat accumulation in the climate system. The resulting estimates are less dependent on global climate models and allow more realistically for forcing uncertainties than similar estimates based on forcings diagnosed from simulations by such models. Base and final periods are selected that have well matched volcanic activity and influence from internal variability. Using 1859–1882 for the base period and 1995–2011 for the final period, thus avoiding major volcanic activity, median estimates are derived for ECS of 1.64 K and for TCR of 1.33 K.
Johansson et al., 2015 (2.5°C equilibrium)
A key uncertainty in projecting future climate change is the magnitude of equilibrium climate sensitivity (ECS), that is, the eventual increase in global annual average surface temperature in response to a doubling of atmospheric CO2 concentration. The lower bound of the likely range for ECS given in the IPCC Fifth Assessment Report was revised downwards to 1.5 °C, from 2 °C in its previous report, mainly as an effect of considering observations over the warming hiatus—the period of slowdown of global average temperature increase since the early 2000s. Here we analyse how estimates of ECS change as observations accumulate over time and estimate the contribution of potential causes to the hiatus. We find that including observations over the hiatus reduces the most likely value for ECS from 2.8 °C to 2.5 °C, but that the lower bound of the 90% range remains stable around 2 °C. We also find that the hiatus is primarily attributable to El Niño/Southern Oscillation-related variability and reduced solar forcing.
Kissin, 2015 (~0.6°C)
[A] doubling the CO2 concentration in the Earth’s atmosphere would lead to an increase of the surface temperature by about +0.5 to 0.7 °C, hardly an effect calling for immediate drastic changes in the planet’s energy policies. An increase in the absolute air humidity caused by doubling the CO2 concentration and the resulting decrease of the outgoing IR flux would produce a relatively small additional effect due to a strong overlap of IR spectral bands of CO2 and H2O, the two compounds primarily responsible for the greenhouse properties of the atmosphere.
Kimoto, 2015 [full] (~0.16°C)
The central dogma is critically evaluated in the anthropogenic global warming (AGW) theory of the IPCC, claiming the Planck response is 1.2K when CO2 is doubled. The first basis of it is one dimensional model studies with the fixed lapse rate assumption of 6.5K/km. It is failed from the lack of the parameter sensitivity analysis of the lapse rate for CO2 doubling. The second basis is the Planck response calculation by Cess in 1976 having a mathematical error. Therefore, the AGW theory is collapsed along with the canonical climate sensitivity of 3K utilizing the radiative forcing of 3.7W/m2 for CO2 doubling. The surface climate sensitivity is 0.14 – 0.17 K in this study with the surface radiative forcing of 1.1 W/m2.
Ollila, 2014 (~0.6°C equilibrium)
According to this study the commonly applied radiative forcing (RF) value of 3.7 Wm-2 for CO2 concentration of 560 ppm includes water feedback. The same value without water feedback is 2.16 Wm-2 which is 41.6 % smaller. Spectral analyses show that the contribution of CO2 in the greenhouse (GH) phenomenon is about 11 % and water’s strength in the present climate in comparison to CO2 is 15.2. The author has analyzed the value of the climate sensitivity (CS) and the climate sensitivity parameter (l) using three different calculation bases. These methods include energy balance calculations, infrared radiation absorption in the atmosphere, and the changes in outgoing longwave radiation at the top of the atmosphere. According to the analyzed results, the equilibrium CS (ECS) is at maximum 0.6 °C and the best estimate of l is 0.268 K/(Wm-2 ) without any feedback mechanisms.
………………………..
Comment
All these papers are dealing with a theoretical effect, so far there hasn’t been one (1) piece of empirical evidence supporting any of the lukewarmers papers. On the contrary, all empirical, real world data suggest there’s no effect – AT ALL.
For example, there hasn’t been any warming in 6 decades (yes, i disregard the FAKE data from NASA et al) despite the fact that that is the time period we actually really started to emit CO2 – ON A MASSIVE SCALE from close to zero.
What more is there to say ..?
