Image: Spring 2017 seasonal tornado outlook
Written by Dr. Sebastian Lüning and Prof. Fritz Vahrenholt (translated/edited by P Gosselin)

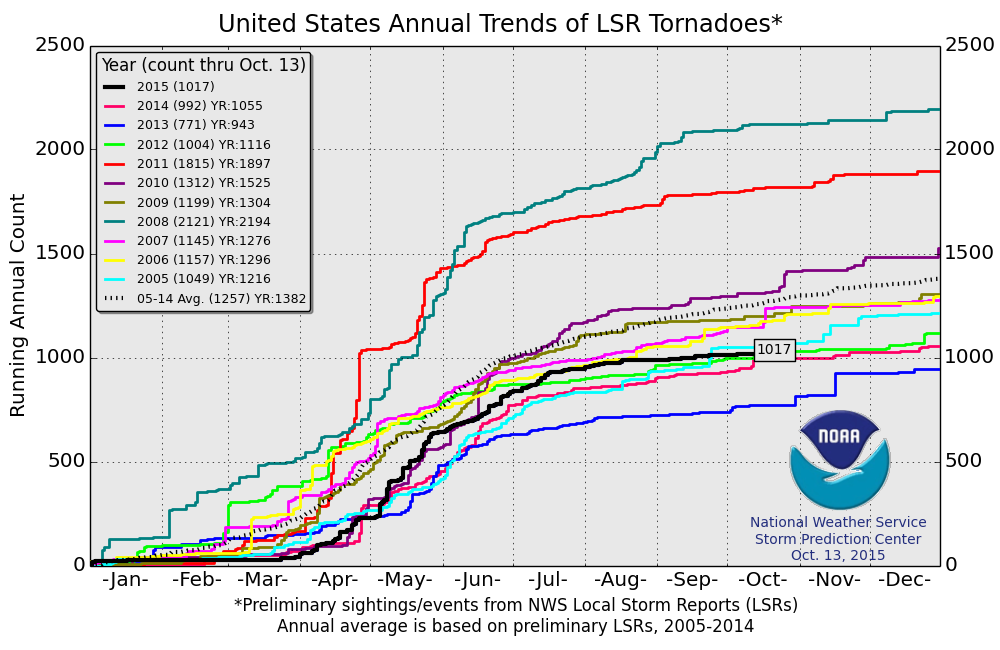
Fig. 1: The cumulative curve showing the number of tornadoes. Chart: NOAA.
We haven’t heard much about tornadoes lately. For a while, they were the favorites among climate activists. When did the love affair end? Here we cast a look at the official NOAA tornado statistics (see graph above)
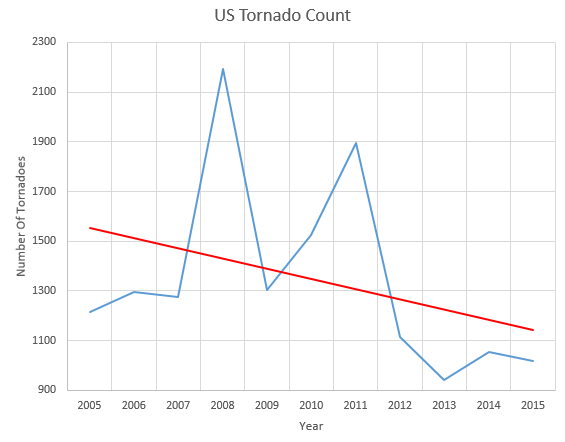
Here we see 2017 was (fortunately) only average. The tornado trend over the past 60 years below shows the comparisons clearly. From 2005-2010 we saw an increased frequency of tornadoes in the USA, but they’ve since become less frequent. That’s bad news for the purveyors of catastrophe stories.

Fig. 2: Number of tornadoes in the USA since 1950. Source: NOAA.
With respect to the dangers of tornadoes, Hannes Stein asked in 2013 at German daily Welt why Americans do not build more stable structures, for example, homes made of stone instead of wood:
Tornado damage is terrible – so why don’t Americans build better homes? That’s what Europeans ask, and thus prove their ignorance and arrogance.”
By the way, one finds an excellent display of global winds at ventusky.com.
So why does tornado activity fluctuate so much over the course of decades? Scientists at the University of Missouri found the answer: Tornadoes are influenced by the Pacific Decadal Oscillation (PDO), as explained in a press release dated October 10, 2013:
Pacific Ocean Temperature Influences Tornado Activity in the U.S., MU Study Finds
Meteorologists often use information about warm and cold fronts to determine whether a tornado will occur in a particular area. Now, a University of Missouri researcher has found that the temperature of the Pacific Ocean could help scientists predict the type and location of tornado activity in the U.S.
Laurel McCoy, an atmospheric science graduate student at the MU School of Natural Resources, and Tony Lupo, professor and chair of atmospheric science in the College of Agriculture, Food and Natural Resources, surveyed 56,457 tornado-like events from 1950 to 2011. They found that when surface sea temperatures were warmer than average, the U.S. experienced 20.3 percent more tornados that were rated EF-2 to EF-5 on the Enhanced Fujita (EF) scale. (The EF scale rates the strength of tornados based on the damage they cause. The scale has six category rankings from zero to five.). McCoy and Lupo found that the tornados that occurred when surface sea temperatures were above average were usually located to the west and north of tornado alley, an area in the Midwestern part of the U.S. that experiences more tornados than any other area. McCoy also found that when sea surface temperatures were cooler, more tornadoes tracked from southern states, like Alabama, into Tennessee, Illinois, and Indiana.
“Differences in sea temperatures influence the route of the jet stream as it passes over the Pacific and, eventually, to the United States,” McCoy said. “Tornado-producing storms usually are triggered by and will follow the jet stream. This helps explain why we found a rise in the number of tornados and a change in their location when sea temperatures fluctuated.” In the study, McCoy and Lupo examined the relationship between tornadoes and a climate phenomenon called the Pacific Decadal Oscillation (PDO). PDO phases, which were discovered in the mid-1990s, are long-term temperature trends that can last up to 30 years. […]. “In the warm phase, which lasted from 1977 to 1999, the west Pacific Ocean became cool and the wedge in the east was warm.”
Also, the El Ninos and the La Ninas (ENSO) impact tornadoes, as documented by Lepore et al. 2017:
ENSO-based probabilistic forecasts of March-May U.S. tornado and hail activity
Extended logistic regression is used to predict March-May severe convective storm (SCS) activity based on the preceding December–February (DJF) El Niño–Southern Oscillation (ENSO) state. The spatially resolved probabilistic forecasts are verified against U.S. tornado counts, hail events, and two environmental indices for severe convection. The cross-validated skill is positive for roughly a quarter of the U.S. Overall, indices are predicted with more skill than are storm reports, and hail events are predicted with more skill than tornado counts. Skill is higher in the cool phase of ENSO (La Niña like) when overall SCS activity is higher. SCS forecasts based on the predicted DJF ENSO state from coupled dynamical models initialized in October of the previous year extend the lead time with only a modest reduction in skill compared to forecasts based on the observed DJF ENSO state.”
There are also tornadoes in Germany from time to time. However, there has been no discernable trend over the past 15 years as shown in Figure 7 in the DWD report.
Read more at No Tricks Zone
……………………………..
US Hurricanes And Tornadoes At A Record Low
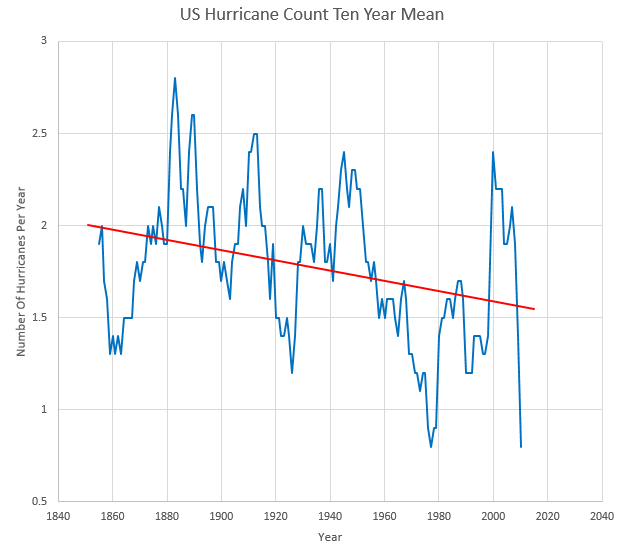
US hurricane strikes peaked in the 1880’s, and have been plummeting ever since. The past ten years has been the quietest on record in the US, with only 8 hurricane strikes. Compare with 1879-1888 when the US was hit by 28 hurricanes.

Similarly, the past four years have been the quietest on record for US tornadoes.


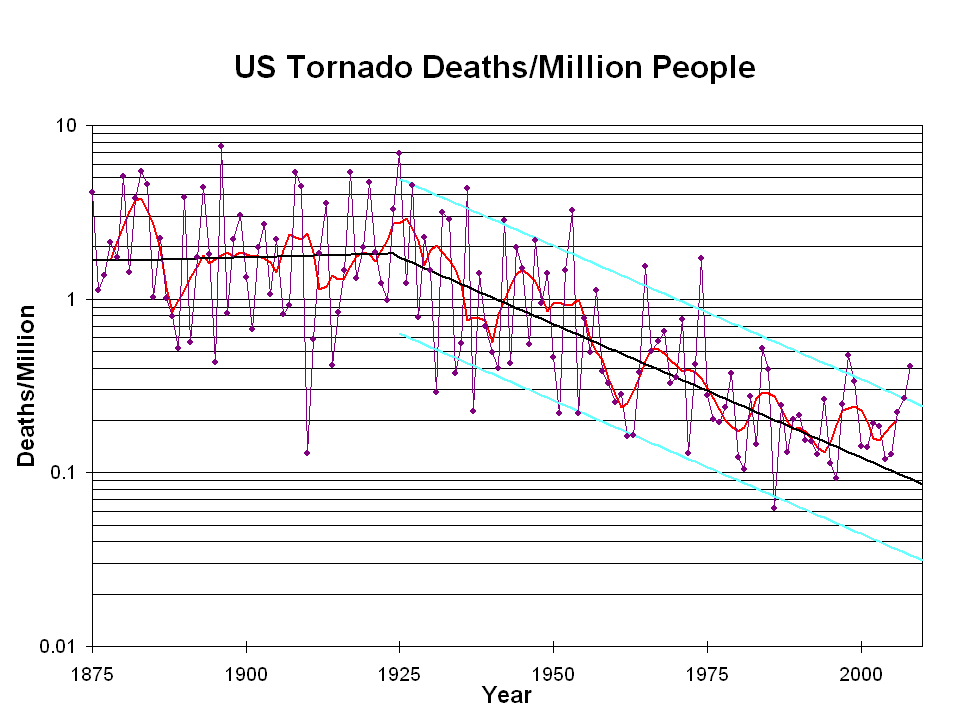
Deaths from tornadoes are also at a record low.

US Annual Tornado Death Tolls, 1875-present – NOAA Weather Partners
Climate alarmists don’t talk about these inconvenient facts, because they completely wreck their scam. So instead they make up fraudulent statistics about “thousand year floods” and other complete nonsense.


