

Image: Tilting at Windmills
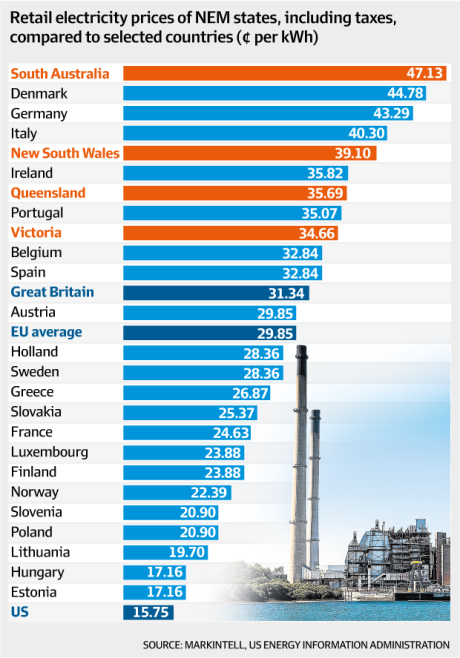
South Australia is renowned as a renewable energy ‘superpower’: by some strange coincidence, it’s also renowned for having the highest retail power prices in the world.
Wind and sun worshippers keep telling us that by plugging into nature’s wonder fuels we’ll soon enjoy power at 1970s prices. Except that that mantra is part myth and part fantasy and, wherever you find endless seas of solar panels and windmills, power prices just keep on rocketing. In SA, wholesale power prices doubled in just 12 months:

Comparing 2016 (red) and 2017 (blue) average
wholesale prices of electricity ($per MWh) by state
For power punters battered with crippling bills, predictions don’t count for much. But still renewables rent seekers keep pumping the line that, one day soon, power prices will plummet. Here’s Donn Dears spelling out precisely why they won’t.
EIA Energy Forecasts Part 1
Power for USA
Dnn Dears
6 March 2018
What’s happening at the Energy Information Administration (EIA)?
Are holdovers from the last administration producing reports that undermine this administration’s energy policies?
The EIA has just issued its latest Annual Energy Outlook, AEO 2018, and it contains a plethora of misinformation.
This and the next two articles will highlight a few of the more egregious items of misinformation.
It’s a mistake for any business or political entity to rely on the EIA energy forecasts.
It should also be noted that the focus of the latest annual energy outlook is on CO2 emissions. According to the latest AEO, CO2 emissions will remain constant through the forecast period ending in 2050.
This substantiates the fact cited in Nothing to Fear that it’s impossible to cut CO2 emissions.
EIA Distorts Cost of Electricity
The EIA predicts that the cost of electricity will decline by 2050 due to the low cost of wind and solar.

Chart from EIA Annual Energy Outlook 2018, issued February 2018
If wind and solar generation increase, as forecast by EIA, the cost of electricity will increase … Not decrease.
Holdovers at the EIA have assumed that the cost of wind and solar will be lower than the cost of electricity using natural gas or coal, and this is a huge error.
In addition, the EIA forecasts that wind and solar will dominate the growth in power generation, accounting for two-thirds of the growth in power generation.

Chart from EIA Annual Energy Outlook 2018, issued February 2018
If the EIA forecast is accurate, it’s clear the cost of electricity will increase substantially.
California, New York, and the New England states, which emphasize renewables, have much higher costs for electricity than do states that rely on coal and natural gas for generating electricity.
Those facts are abundantly clear and were available to the EIA when it created this distorted report.
These facts are accentuated by the EIA forecast growth for renewables, which is predominantly for PV solar, an extremely expensive method for generating electricity.

Chart from EIA Annual Energy Outlook 2018, issued February 2018
Not only is PV Solar expensive, it requires storage, which, at a minimum, doubles the cost of electricity.
In addition, the EIA has created a new measurement, Levelized Avoided Cost of Electricity (LACE) to justify its cost estimates.
“The calculation of avoided costs is based on the marginal value of energy and capacity that would result from adding a unit of a given technology to the system as it exists or is projected to exist at a specified future date and represents the potential value available to the project owner from the project’s contribution to satisfying both energy and capacity requirements.”
LACE uses marginal cost, which ignores total costs. See, The System is Rigged.
Conclusion
The EIA has become an albatross left over from the Obama administration, distorting facts to promote renewables and the cutting of CO2 emissions.
Any organization that uses the EIA’s forecasts are perpetuating misinformation and promoting distortions in the economy.
It should be noted that Navigant Research has embraced the EIA information and published articles extolling the EIA forecasts.
The EIA is an excellent example of what happens when ideologues assume responsibility for a government administration that is supposed to provide accurate information to the public.
Hopefully, the Department of Energy (DOE) will take steps to eliminate the biases prevalent at the EIA.
Power for USA
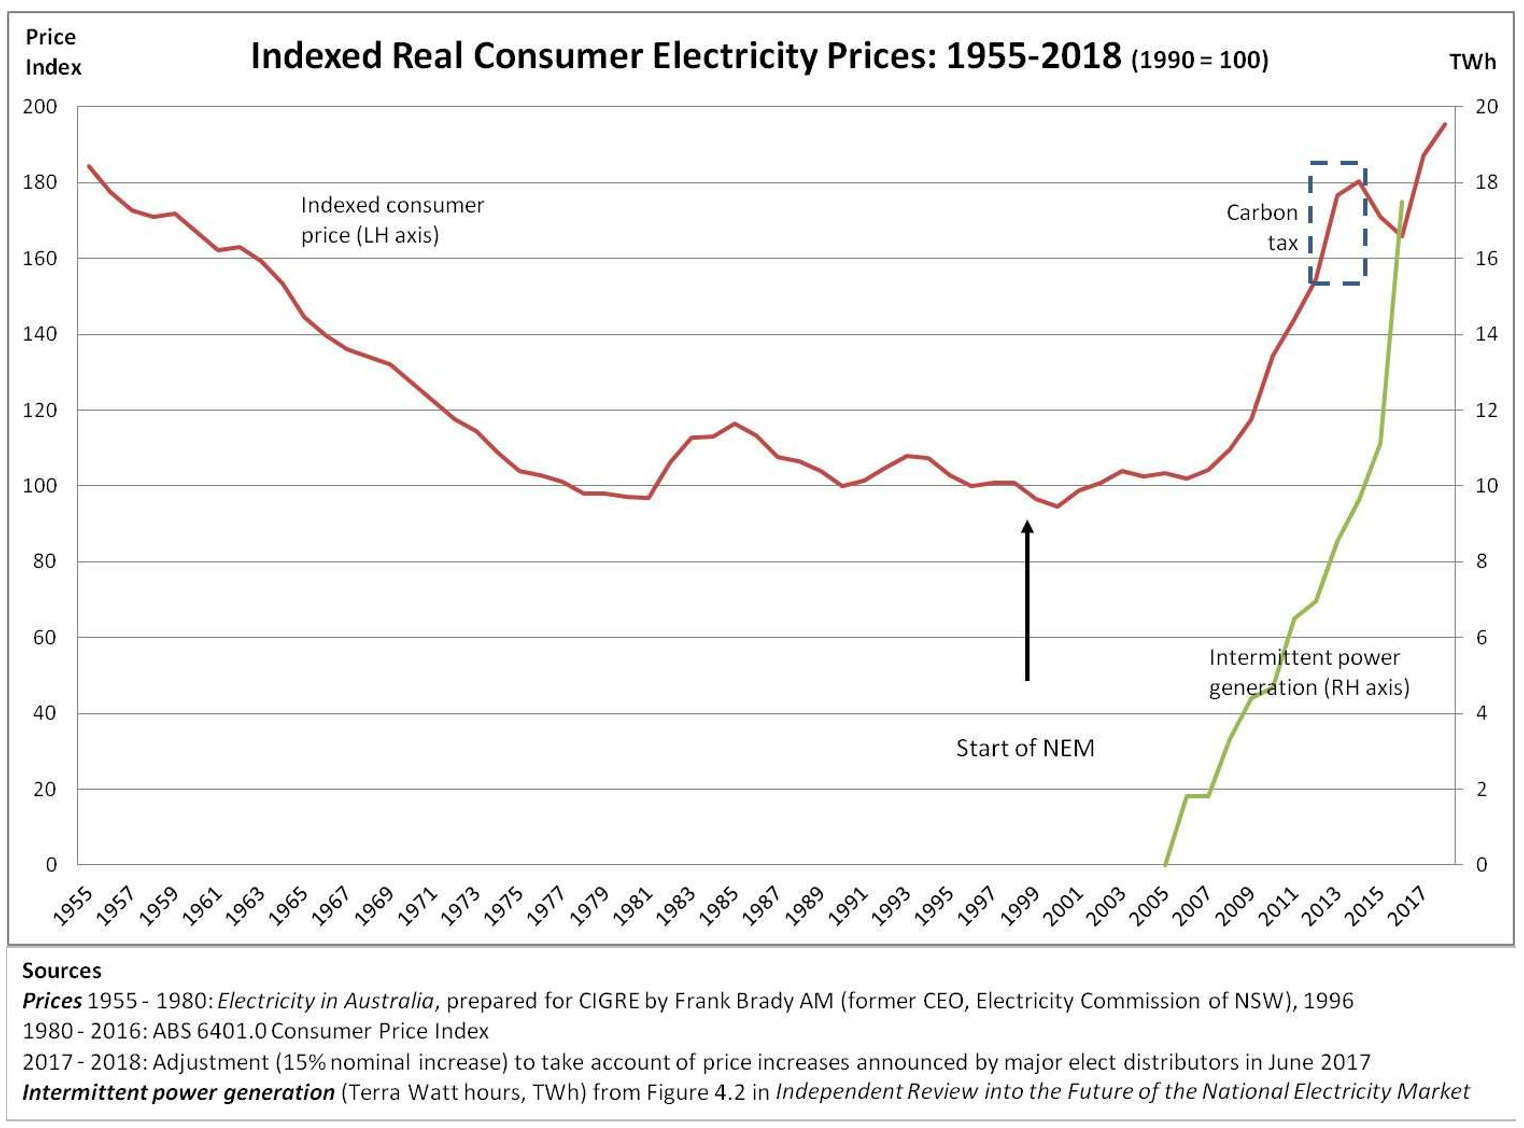
Having trouble making the connection between heavily subsidised, intermittent, market distorting wind & solar and rocketing power prices? See above the Australian experience (so far) and below for what’s about to happen in the US.
EIA Distorts Energy Forecasts, Part 2
Power for USA
Donn Dears
9 March 2018
The Energy Information Administration (EIA) is providing misinformation to Americans in support of cutting CO2 emissions and promoting renewables.
The following is another example of how the EIA is making unsubstantiated, misleading claims.

Chart from EIA Annual Energy Outlook 2018, issued February 2018
In this chart, EIA forecasts that PV solar, rooftop installations, will account for 200,000,000 KW of installed capacity by 2050.
The average single, family-owned home requires about 8KW of installed PV solar capacity.
There are approximately 75,000,000 such homes in the United States, of these, using 8KW for the average installation, 25,000,000 will have installed PV rooftop solar according to the EIA forecast.
This is 33% of all single-family homes in the United States.
On the face of it, this is an absurd number of installations.
In essence, it says that virtually every single family home in the Southern US would have PV rooftop solar installed.
While the cost of solar panels could come down, the cost of inverters and the physical installation won’t decrease by very much.
Based on current costs, without subsidies, and the price of electricity, only Southern California (8 years) and Hawaii (3 years) require fewer than ten years to recover the cost of installing PV rooftop solar.
Here are some other break-even calculations for various states, showing the number of years it takes to recover the cost of installing PV rooftop solar. (From Nothing to Fear)
Alabama 18, Arizona 10, Arkansas 23, Colorado 14, Florida 11, Georgia 15, New Mexico 11, Texas 15 and Louisiana 19.
These PV rooftop solar systems are supposed to last about twenty years.
Any PV rooftop solar installed today will probably be replaced at least once by 2050.
In addition, it should be noted that the roofs themselves need to be replaced every twenty years or so. Replacing roofs will require removal and reinstallation of the PV rooftop solar system unless the two events take place simultaneously.
According to the EIA, AEO 2018, “Social influences will contribute to the continued adoption of residential photovoltaic (PV).”
This infers government forcing the adoption of PV solar by propaganda and intimidation using the fear of global warming.
It should be noted that the EIA, AEO 2018 makes similar unsubstantiated claims with regard to the use of energy by industry.
The EIA is a rogue agency that the Department of Energy must get under control.
As it stands today, no one should believe anything published by the EIA in its energy forecasts.
Power for USA

Ref.: https://stopthesethings.com/2018/04/01/renewables-are-cheap-myth-busted-full-cost-of-wind-solar-simply-staggering/
