
")
By Paul Homewood – NOT A LOT OF PEOPLE KNOW THAT
The BBC has been up to its tricks again!

http://www.bbc.co.uk/programmes/b09yddxd
The latest edition of Radio 4’s environmental programme, “Costing the Earth”, looks at how our springs are supposedly getting earlier. (Yes, I know springs start on 1st March!)
The programme’s opening introduction by presenter Lindsey Chapman gives us a clue that it won’t be an objective assessment:
We’re looking for signs of how a volatile climate is shifting our seasons, and affecting both our native wildlife and migrant visitors to these shores.
Chapman, also presenter of the Springwatch TV series, then adds:
I’ve been noticing changes on my own patch, from the arrival of the first swallows to the flowering times of spring flowers over the last ten years.
At about seven minutes in though, she makes this extraordinary statement:
Spring now arrives an average of 26 days earlier each year than it did 10 years ago. We know this because of the extraordinary records kept by the public, stretching back centuries.
As Paul Matthews points out:
This statement that Spring is almost a month earlier than it was just 10 years ago is complete nonsense and fails the most elementary sanity check. It appears, yet again, that where global warming is concerned, elementary common sense and fact-checking are thrown out by the BBC, and replaced with absurd exaggeration and alarmism.
So where did Chapman get this crazy claim from?
As she goes on to explain, it is supposedly from the Woodland Trust, who run a scheme called Nature’s Calendar.
This allows members of the public to record when they first see certain events each spring, such as birds, first flowerings, butterflies and so on. In other words, phenology. During warm springs, naturally enough, these events tend to arrive earlier.
According to Woodland Trust, these first sightings have been between around one and two weeks earlier in the last three years, though some butterfly and bird arrivals were as much as three weeks early in 2017:

https://naturescalendar.woodlandtrust.org.uk/analysis/seasonal-reports/
You will notice that Woodland Trust use 2001 as a baseline, and nowhere do they claim that spring is now 26 days earlier than ten years ago.
But why 2001? In fact they have only been collecting this data since 2000, and decided to use 2001 as the base year because, they claim, weather conditions that year “closely reflected the 30-year average”.
However, on closer examination we see that it is not the current 30-year average they are talking about (ie 1981-2010), but 1961-90.

This is highly significant, because the 1961-90 period was considerably colder than both the decades that preceded and followed it.

https://www.metoffice.gov.uk/hadobs/hadcet/data/download.html
HH Lamb pointed out that the onset of spring in Oxford was 16 days later between 1963-80, compared to 1920-50:

HH Lamb – “Climate History and the Modern World” (p 274):
To a large extent therefore, the onset of spring in recent years has merely returned to earlier patterns, with the end of the colder interlude.
We can see the effect of using the two different baselines below:

https://www.metoffice.gov.uk/hadobs/hadcet/data/download.html
The 1961-90 period was 0.7C colder than 1981-2010. We can also see that, while there have been ups and downs, there is little evidence of overall change in spring temperatures since around 1990.
This is definitely not the message portrayed by the BBC programme.
We should also note that the spring of 2001 was much colder than prior years, which makes it strange that it should be used as a base year at all. The Woodland Trust recognised this same point in their Spring 2005 report:

https://naturescalendar.woodlandtrust.org.uk/analysis/seasonal-reports/?p=3
Of course, when we are talking about “early springs”, temperatures in January and February may be just as important as those in April and May.
But when we look at Jan-March, and Feb–April, we find a very similar pattern – very little change in trend since 1990:


https://www.metoffice.gov.uk/hadobs/hadcet/data/download.html
This should be little surprise, when we see that, contrary to popular myth, temperatures in January and February have changed little since a century ago.
And, as with spring temperatures, there is a noticeable dip between 1961-90:


https://www.metoffice.gov.uk/climate/uk/summaries/actualmonthly
Summary
There appears to be no evidence to back up Chapman’s claim that spring now arrives an average of 26 days earlier each year than it did 10 years ago, either in the temperature record or in the Woodland Trust surveys.
The latter are in any event misleading, and certainly not in a shape or from “scientific”. Their conclusions are obtained only by using an unusually cold year, 2001, as their base point.
There is actually nothing in the temperature record to suggest that springs are beginning any earlier than they were thirty years ago.
To be fair, one of the interviewees, Matthew Oates of the National Trust, did mention that the transition to warmer/earlier springs began several decades ago.
Nevertheless, the central theme of the programme was that the UK climate is changing rapidly, something not borne out by the data.
I have no doubt that the BBC will fall back on their regular defence of “scientists say”. However, following OFCOM’s recent ruling that the BBC should have challenged Lord Lawson on comments he made, it should surely not be acceptable for them to simply accept unscientific research from bodies like the Woodland Trust without challenging that as well.
Of course, in this instance the BBC has gone one step further. Not only have they broadcast the Woodland Trust’s findings, Lindsey Chapman has actually then presented them as an indisputable fact.
Ref.: https://notalotofpeopleknowthat.wordpress.com/2018/04/21/spring-arriving-26-days-early-bbc/
………….
A ‘Climate Boundary Shift’ Is The Latest Example Of Media Exceeding Reality

A new paper published in the AMS Earth Interactions entitled, Whither the 100th Meridian? The Once and Future Physical and Human Geography of America’s Arid-Humid Divide, Part II: The Meridian Moves East, discusses the climate model-expected drying of the western U.S. and how this will affect the agricultural central- and east- U.S. as the climatological boundary roughly represented by the 100th Meridian moves eastward.
This paper has become a good example of media hype overwhelming actual substance. For example, take this headline from Doyle Rice at USAToday on April 13,
“A major climate boundary in the central U.S. has shifted 140 miles due to global warming”
So, what’s wrong with the headline? Nowhere in the original scientific study can I find any observational evidence of such a shift.
The fact is, the study is a modeling study — not observational. They tell us what might happen in the coming decades, given certain (and numerous) assumptions.
Since I’ve been consulting for U.S. grain interests for the last seven or eight years, I have some interest in this subject.
Generally speaking, climate change isn’t on the Midwest farmers’ radar because, so far, there has been no sign of it in agricultural yields.
Yields (production per acre) of all grains, even globally, have been on an upward trend for decades.
This is fueled mainly by improved seeds, farming practices, and possibly by the direct benefits of more atmospheric CO2 on plants. If there has been any negative effect of modestly increasing temperatures, it has been buried by other, positive, effects.
And so, the study begs the question: how has growing season precipitation changed in this 100th meridian zone?
Using NOAA’s own official statewide average precipitation statistics, this is how the rainfall observations for the primary agricultural states in the zone (North and South Dakota, Nebraska, Kansas, and Oklahoma) have fared every year between 1900 and 2017:
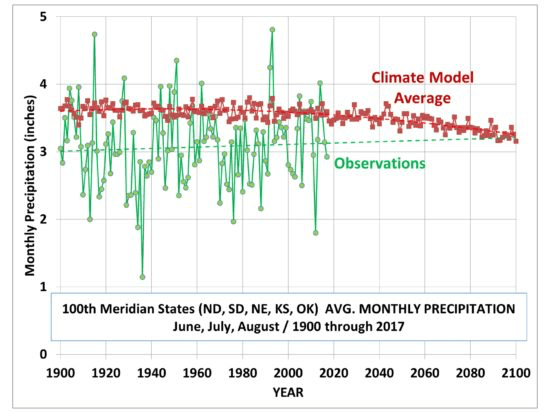
Jun, July, August average monthly precipitation as observed over 5 U.S. states encompassing the 100th Meridian, and as predicted by a CMIP5 (RCP8.5 forcing scenario) multi-model mean from 35N to 50N, and 95W to 105 W (observational data from https://www.ncdc.noaa.gov/cag/statewide/time-series; model data from https://climexp.knmi.nl/selectfield_cmip5.cgi?id=someone@somewhere)
What we see is that there has been, so far, no evidence of decreasing precipitation amounts exactly where the authors claim it will occur (and according to press reports, has already occurred).
To the authors’ credit, in their final “Discussion and Conclusions” section of the research paper they admit:
“First, we have shown that state-of-the-art models simulate the aridity gradient across North America poorly.”
“Second, while current Earth system models predict widespread declines in soil moisture and increases in continental aridity, they also simulate increases in net primary productivity.
This is because, within the models, the beneficial effects on photosynthesis and water-use efficiency of increased CO2 overwhelm the effects of increased temperature and vapor pressure deficit.” (emphasis added)
The positive effects of more CO2 on global agricultural yields have been tallied, as I have previously discussed here.
Yet, the popular press emphasizes the alarmist nature of the article, even going so far as to make as the central claim something that, as far as I can tell, isn’t even in the paper (!)
Read more at Dr. Roy Spencer’s Blog
