

Image: Glacier Museum in Norway
By Tony Heller

Glaciers and climate — The Norwegian Glacier Museum
The Norwegian Glacier Museum claims an incredible climate sensitivity of 8°C per 100 PPM CO2, or 1°C per 10 PPM CO2. Through burning of coal and petroleum products mankind has increased the amount of carbon dioxide as much as the natural difference between ice ages and interglacials, which is the equivalent to 8 °C.
Yet their graph shows a climate sensitivity of zero. As CO2 has risen 100 PPM over the past century (red line), there has been no corresponding increase in temperature (blue line. )
The lack of correlation over the past century shows that changes in CO2 have historically been a response to temperature changes, not the cause of them. An entire field of science is based around a fundamental inability to read graphs and think logically.
Read more at realclimatescience.com
………..
THE SUN : Climate Changer, Climate Driver, Climate Disruptor

***
LAST week we analysed the profound effect that the Sun has on Earth’s climate and the sinister reasons as to why the Climate Crisis Industry almost completely dismisses it as having any effect on climate and weather:
THE SUN : Climate Control Knob, Enemy Of The Climate Cult | Climatism
THROUGH the forensic lens of Tony Heller’s excellent research, let’s take a deeper dive into the ‘conveniently’ dismissed nuclear-powered giant in the sky that has the ability to generate temperature swings of 40 degrees centigrade on any given day. And whose light, that takes 8 minutes and 20 seconds to reach Earth, delivers enough energy in one hour to power the world economy for an entire year!
How James Hansen And Michael Mann Destroyed Climate Science
Climate scientists used to understand that the sun controlled Earth’s climate – until Michael Mann and James Hansen destroyed the temperature record about 20 years ago.
Total solar irradiance (TSI) has increased since the Little Ice Age.
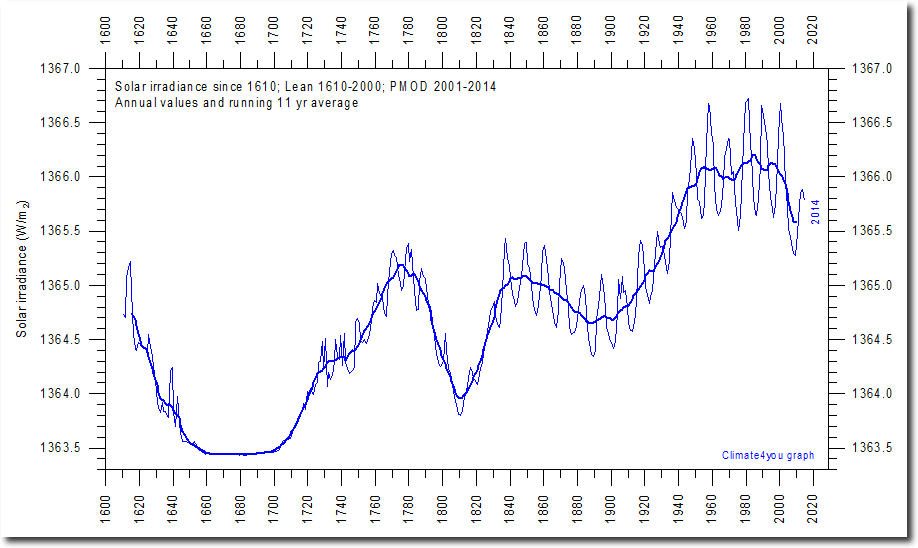
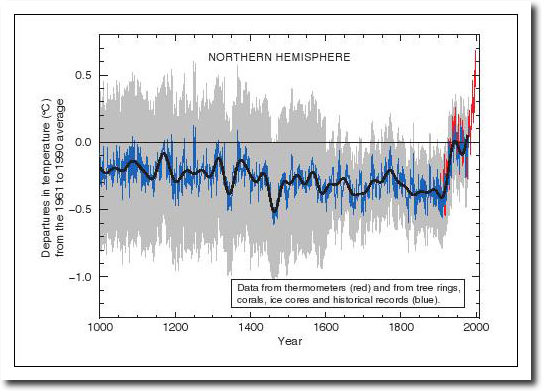
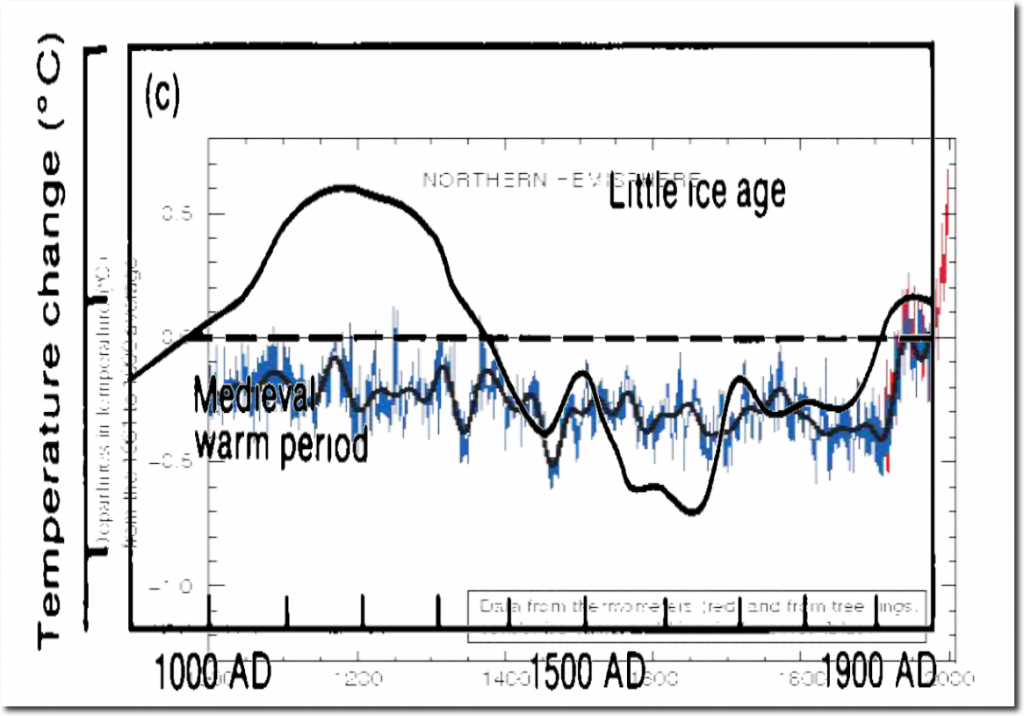
The graph below is from the 1990 IPCC report, and it shows temperatures were much warmer 900 years ago, and were much cooler 400 years ago during the Little Ice Age.
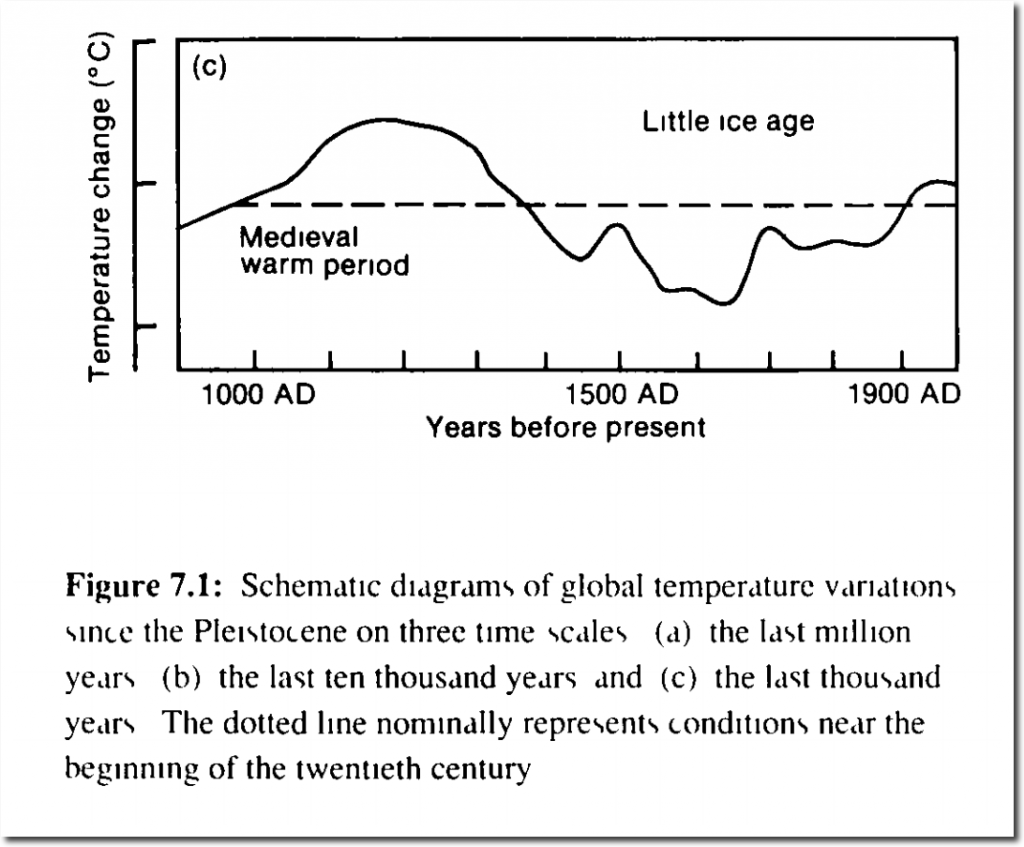
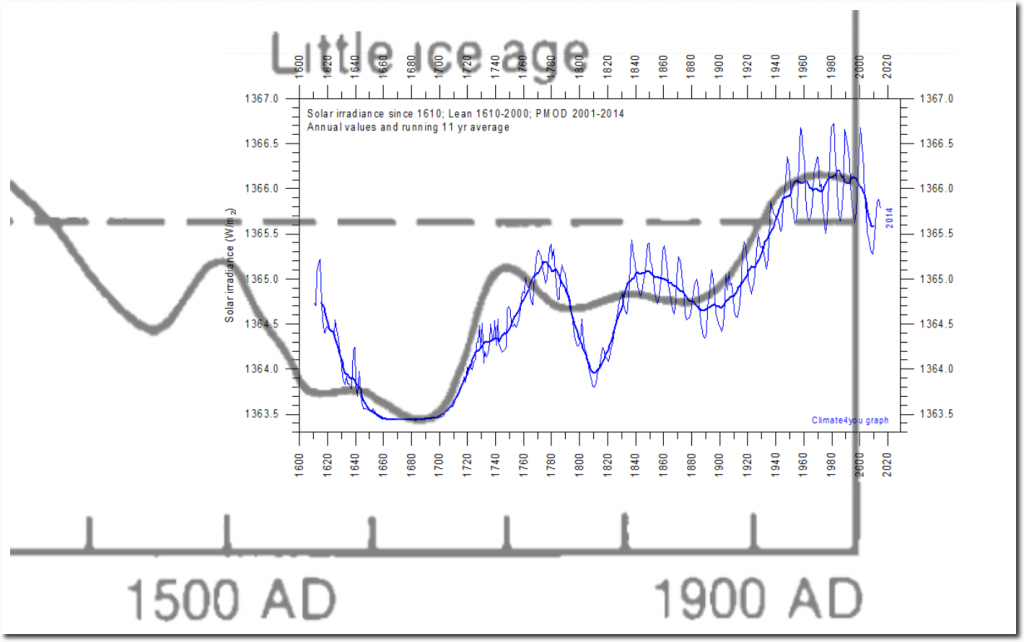
If we overlay the TSI graph and the 1990 IPCC graph, we see correlation between temperature and TSI.
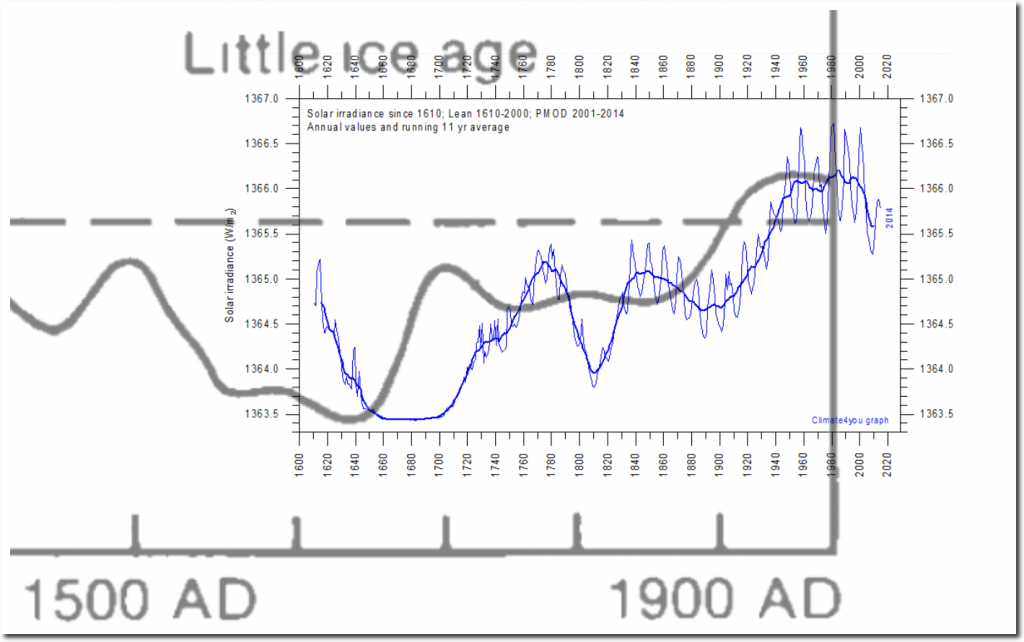
The 1990 IPCC graph is hand drawn and the X-axis is irregular. A small shift and scaling change lines up TSI and temperature almost perfectly.
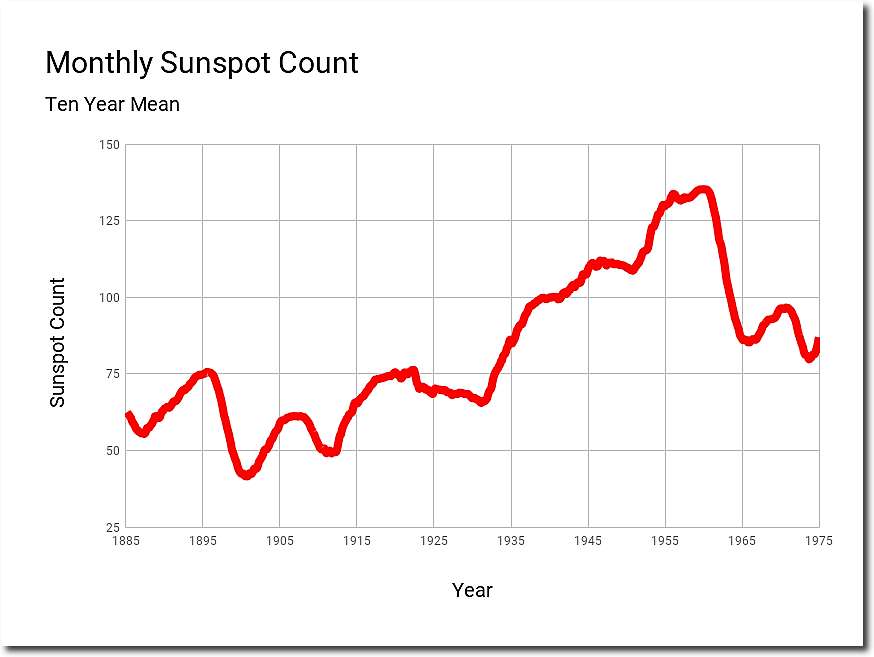
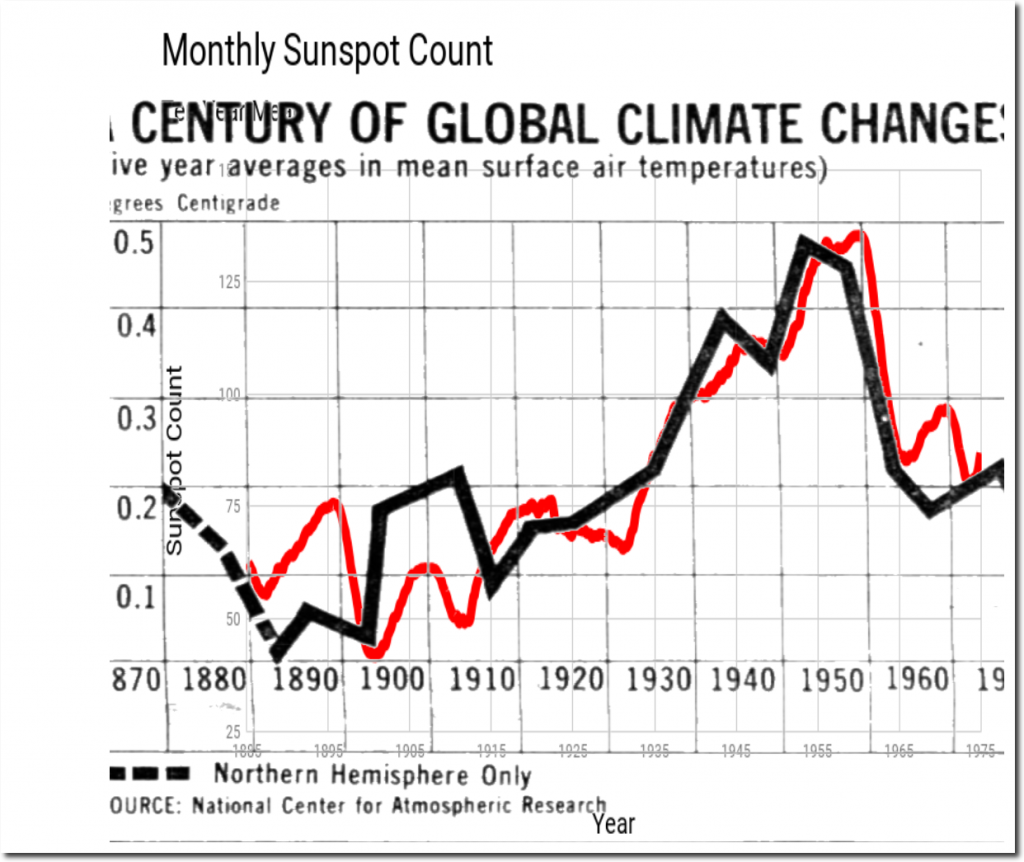
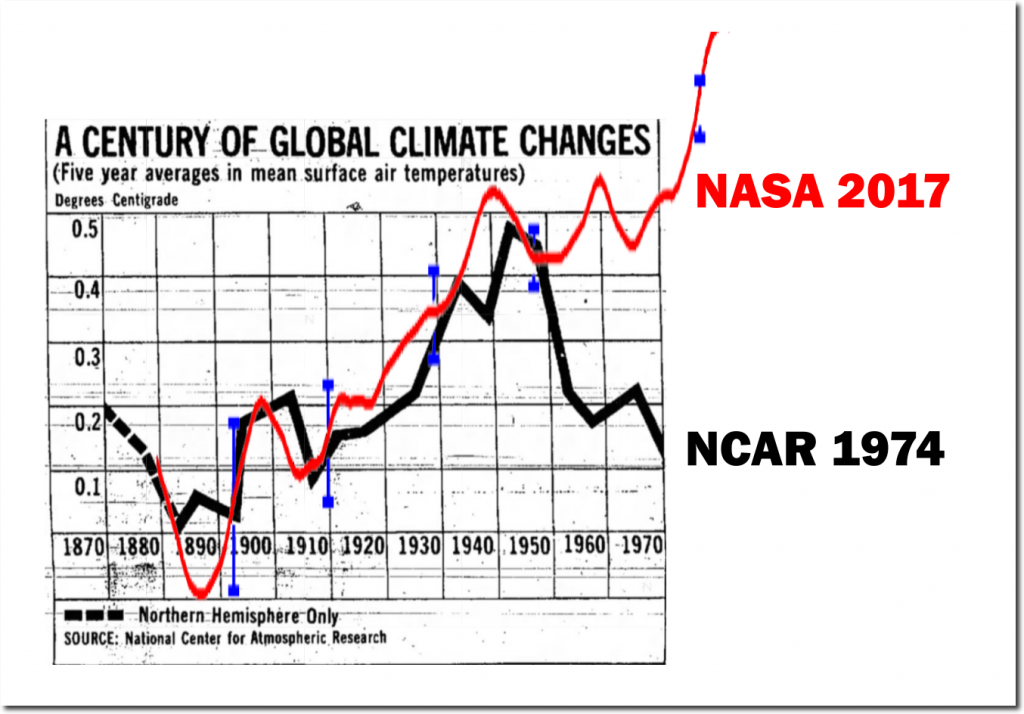
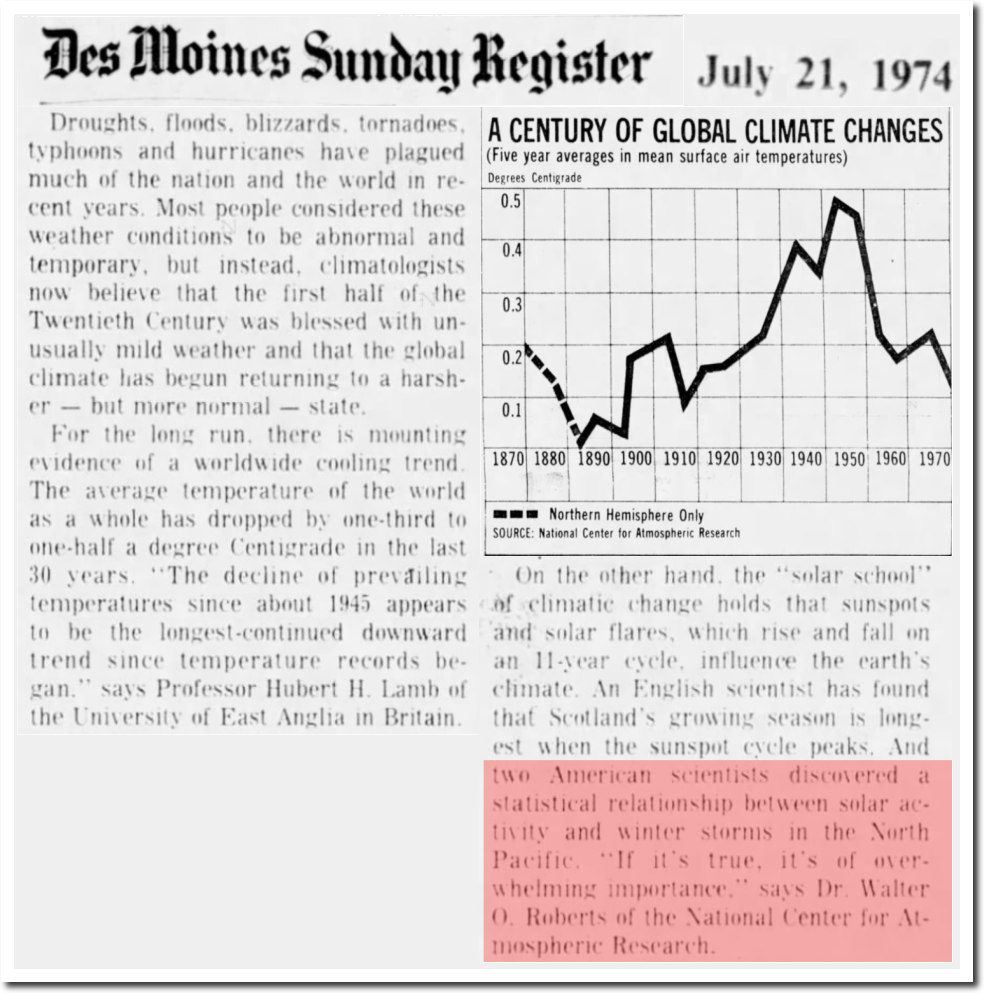
Similarly, we see a correlation between the 1974 NCAR global temperature graph and sunspots.
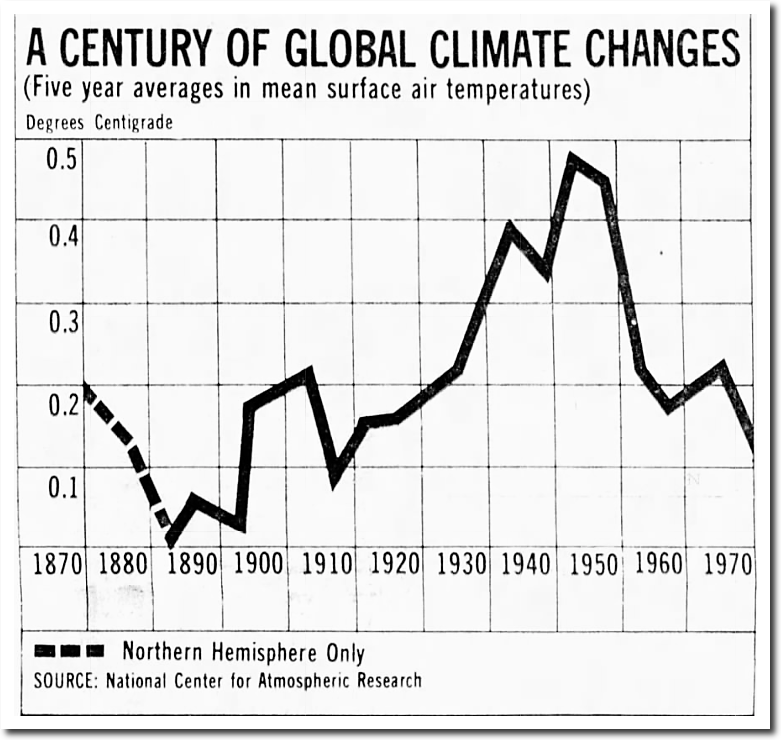
21 Jul 1974, 13 – The Des Moines Register at Newspapers.com
Wood for Trees: Interactive Graphs
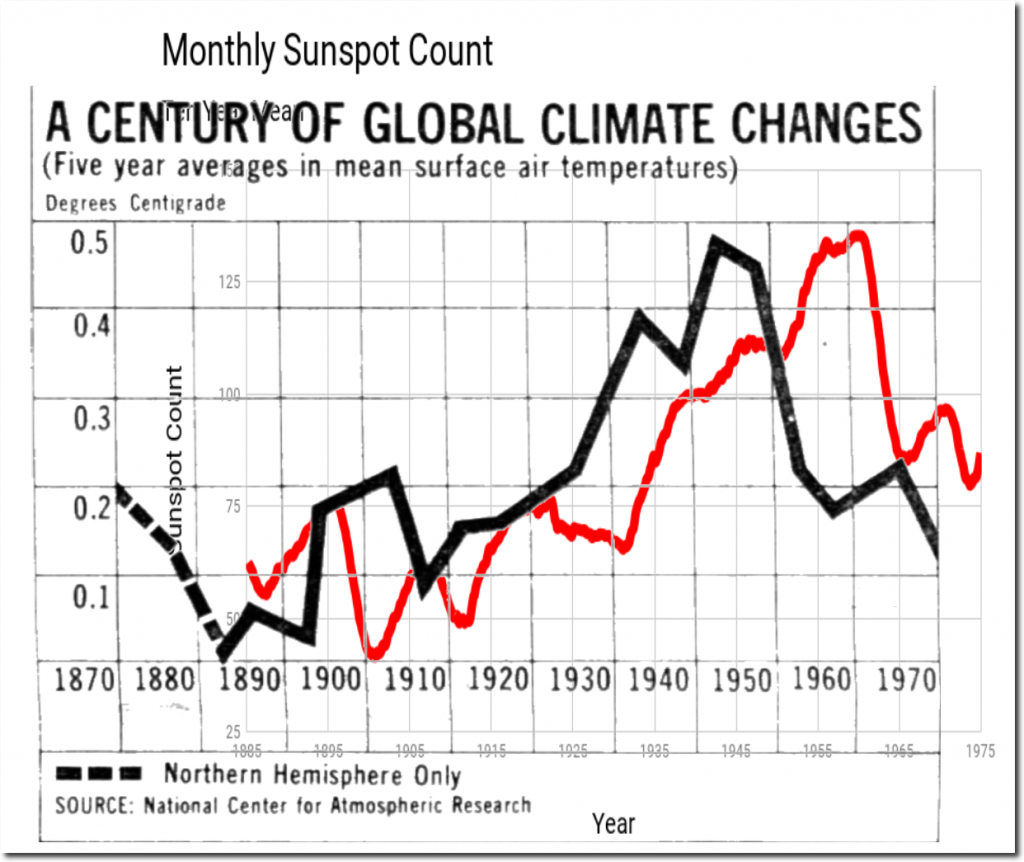
Again, a small shift of the hand drawn 1974 graph causes sunspots and temperature to line up very closely.
TSI and Sunspots are only part of the solar climate story. Comets have two tails because there are at least two distinct types of energy being emitted from the Sun – photons and ionized particles known as the Solar Wind.
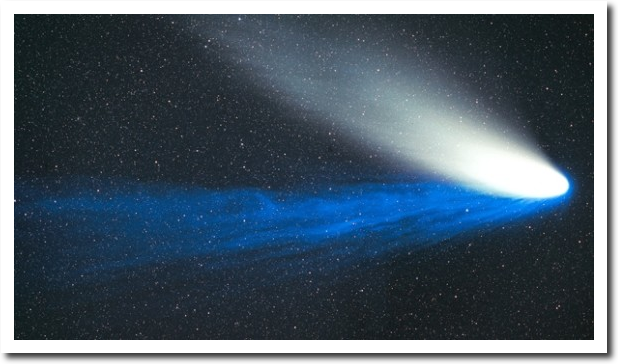
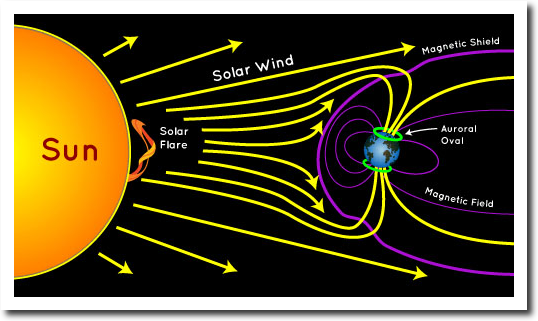
The Earth’s magnetic field protects us from the Solar Wind – directing the charged particles towards the poles where they release energy as the Northern and Southern lights. Without the magnetic field surrounding Earth, our planet would be unlivable.
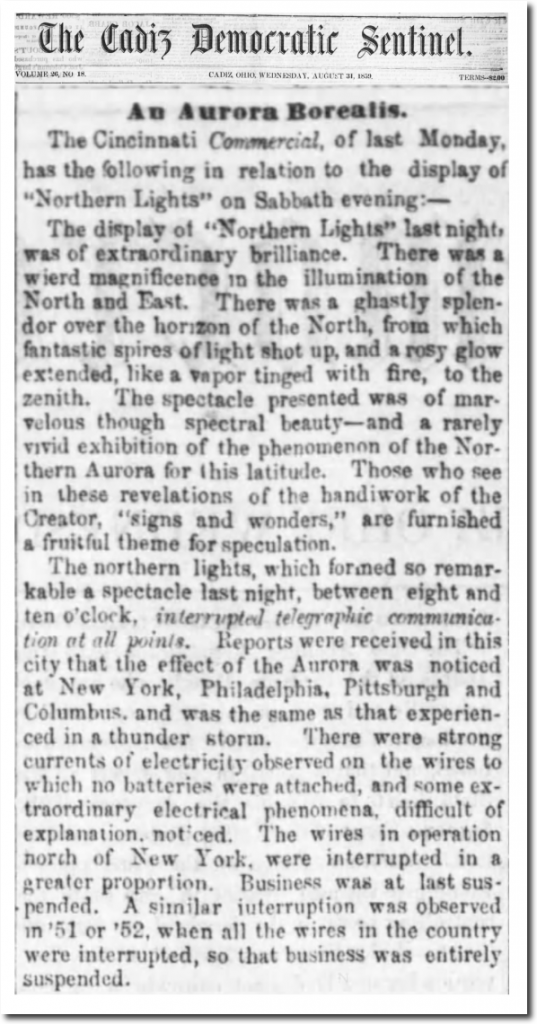
In 1859, a large solar storm brought charged particles across the entire planet, with so much energy that people all over the world could read at night, and telegraph lines carried current without any power supply.
The storm came from a coronal mass ejection which was released from this sunspot group

The solar wind brings a lot of very variable energy into Earth’s atmosphere, which is completely unaccounted for by climate scientists. And because the Earth’s and Sun’s magnetic fields are constantly changing, this causes weather patterns on earth to change too – leading to all sorts of superstitions like the current “climate change” cult.
The correlation between solar activity and earth’s temperature was obvious until 20 years ago when Michael Mann and James Hansen corrupted Earth’s temperature record through massive data tampering. Mann made the Medieval Warm Period and Little Ice Age disappear with his hockey stick graph.
Meanwhile Hansen made the 1940’s warmth and subsequent cooling disappear.
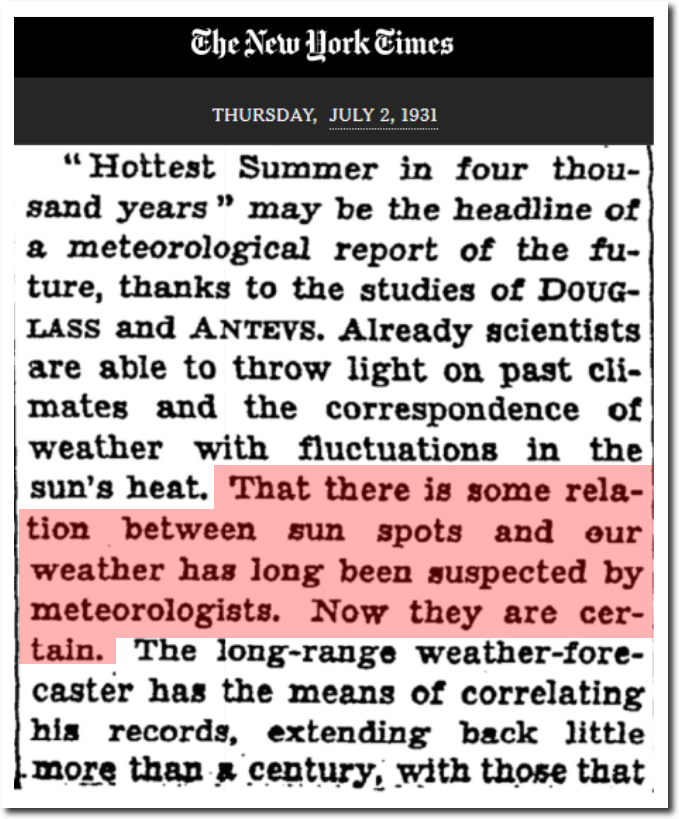
There was no question at the time that the 1930’s and 1940’s were very warm, and that the temperatures correlated with solar activity.

17 Dec 1939, Page 15 – Harrisburg Sunday Courier
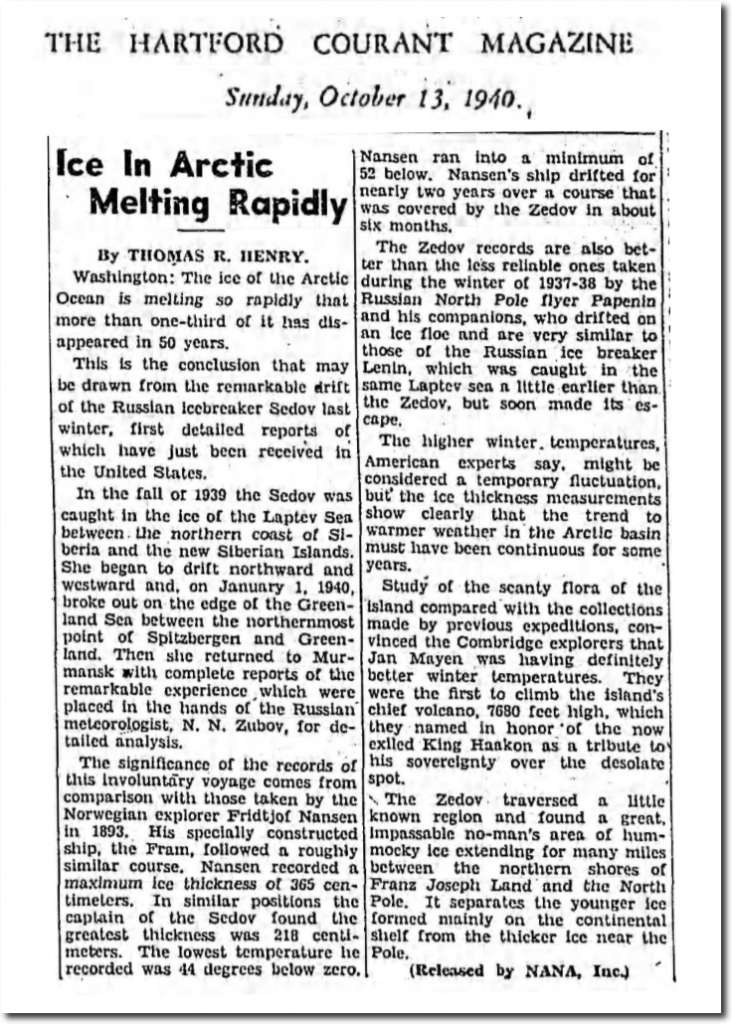
13 Oct 1940, Page 76 – Hartford Courant at Newspapers.com
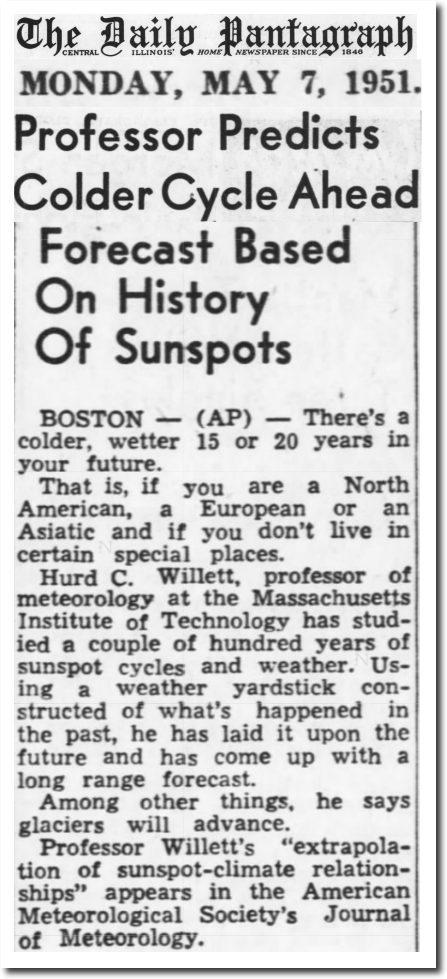
In 1951, MIT professor Hurd C. Willett correctly predicted 20 years of global cooling, based on sunspot cycles.
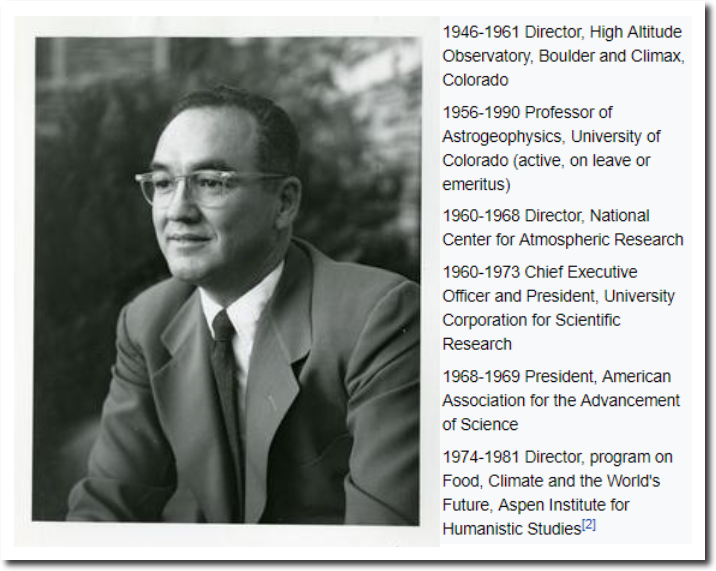
The first director of NCAR understood that sun controlled earth’s climate.
In 1973, Roberts predicted a drought based on sunspot cycles
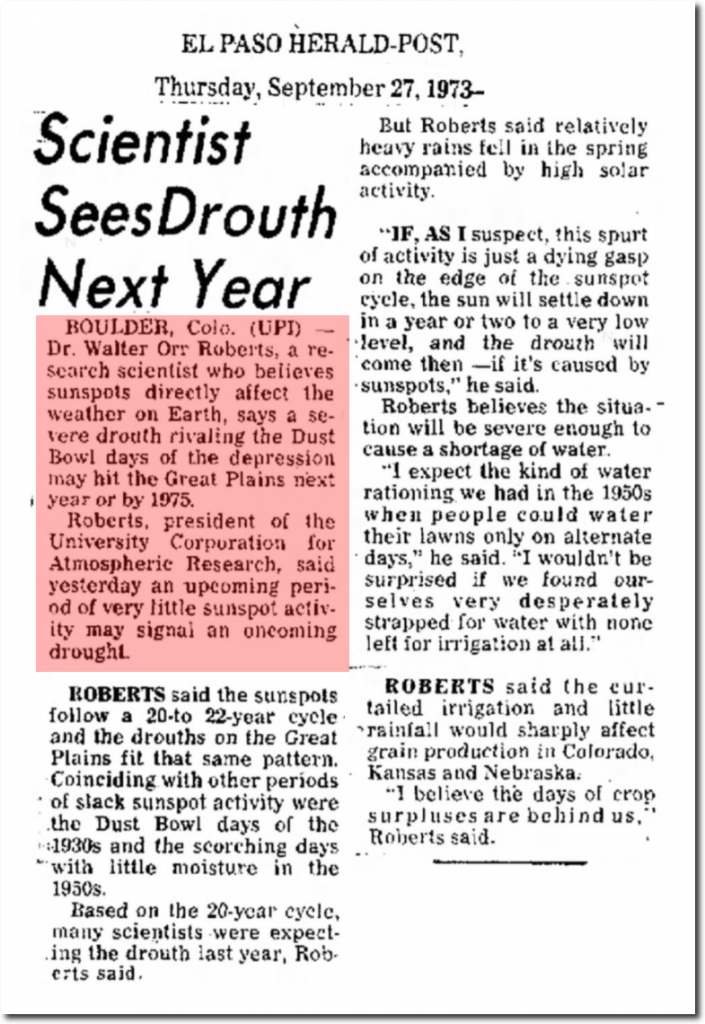
27 Sep 1973, Page 38 – El Paso Herald-Post at Newspapers.com
By destroying the temperature record, Mann and Hansen wrecked an entire field of science – and caused scientists to pursue a superstitious relationship between temperature and CO2 instead of doing actual research.
How James Hansen And Michael Mann Destroyed Climate Science | The Deplorable Climate Science Blog
OMITTING the Sun as a key driver of climate change, one might ask the question: Who are the real science “deniers”?
•••
Related :
- THE SUN : Climate Control Knob, Enemy Of The Climate Cult | Climatism
- “Runaway Global Warming” Update: 48,000 Brits Dead After Worst Winter In 42 Years | Climatism
- Svensmark: “global warming stopped and a cooling is beginning” – “enjoy global warming while it lasts” | Climatism
- The Sun | Climatism
- ANTARCTICA : It’s Time We Had That Talk | Climatism
- THE ARCTIC : Ground Zero For Anthropogenic Hubris And Climate Change Hysteria | Climatism
- U.S. Olympians Head To Capitol Hill In Bid To “Salvage” Winters From Climate Change | Climatism
Origins Of The Global Warming Scam :
- WESTERN Nations, Driven By A Global Agenda Of Climate Alarmism, Are Destroying Their Industries With Carbon Taxes And Promotion Of Expensive, Intermittent Green Energy | Climatism
- TOMORROW’S Grim, Global, Green Dictatorship | Climatism
- CLIMATE CHANGE – The Most Massive Scientific Fraud In Human History | Climatism
- “In Searching For A New Enemy To Unite Us, We Came Up With The Threat Of Global Warming” | Climatism
- Global Warming Is The Greatest And Most Successful Pseudoscientific Fraud In History | Climatism
See Also :
- IT’S Official : Global Warming Alarmists Have No Credibility On Anything Climate Change | Climatism
- Mother Nature Not Behaving As Climate Scientists Expected | Climatism
- LIFE Inside The Global Warming Bubble | Climatism
- HOTTEST Arctic Ever? Arctic Climate Change Fairytales vs. Reality | Climatism
- ARCTIC Temperatures Plunge! (Don’t expect mainstream media to cover it) | Climatism
- LIVING Life With “Atmosphere Cancer” | Climatism
- 8 INCHES Of Catastrophic Global Warming Cooks Dutch Canals | Climatism
- SNOWFALL Will Become “A Very Rare And Exciting Event…” | Climatism
- “THE PAUSE” Lives On : Global Temperatures Continue To Cool Despite Record And Rising CO2 Emissions | Climatism
