Image: NASA Is Making Troves of Satellite Data More Accessible Than Ever
In 1972, forty-two “top European and American investigators” predicted a rapidly approaching new ice age – based on an increase in snow and ice cover from 1967-1972.
The technique employed ….. depends on the averaging of information from standard and ‘infra-red satellite weather pictures.

29 Jan 1974, 5 – The Guardian at Newspapers.com
The Arctic climate was becoming more frigid, the ice was getting “ominously thicker.”
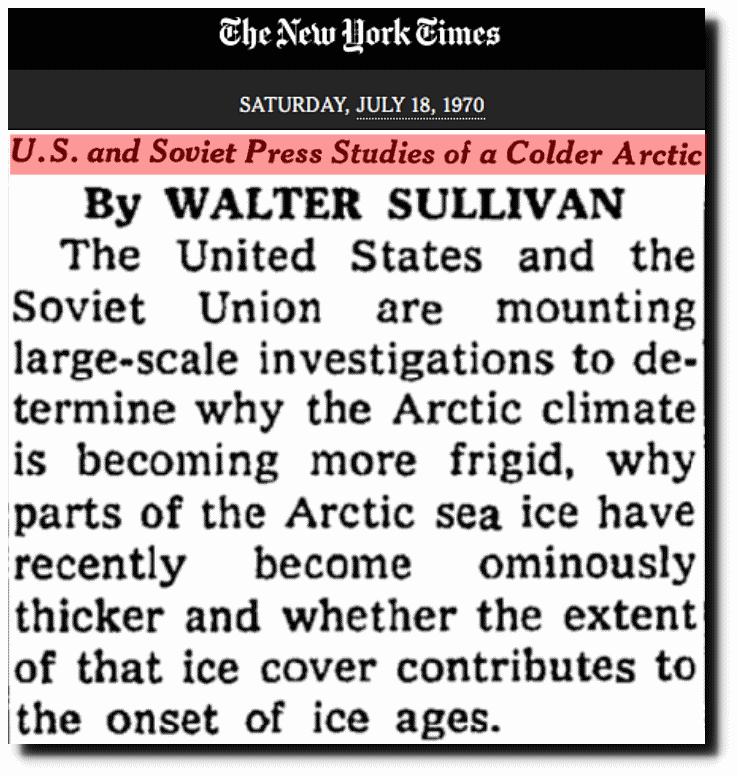
U.S. and Soviet Press Studies of a Colder Arctic – The New York Times
Icelandic ports were blocked with ice for the first time in the 20th century.
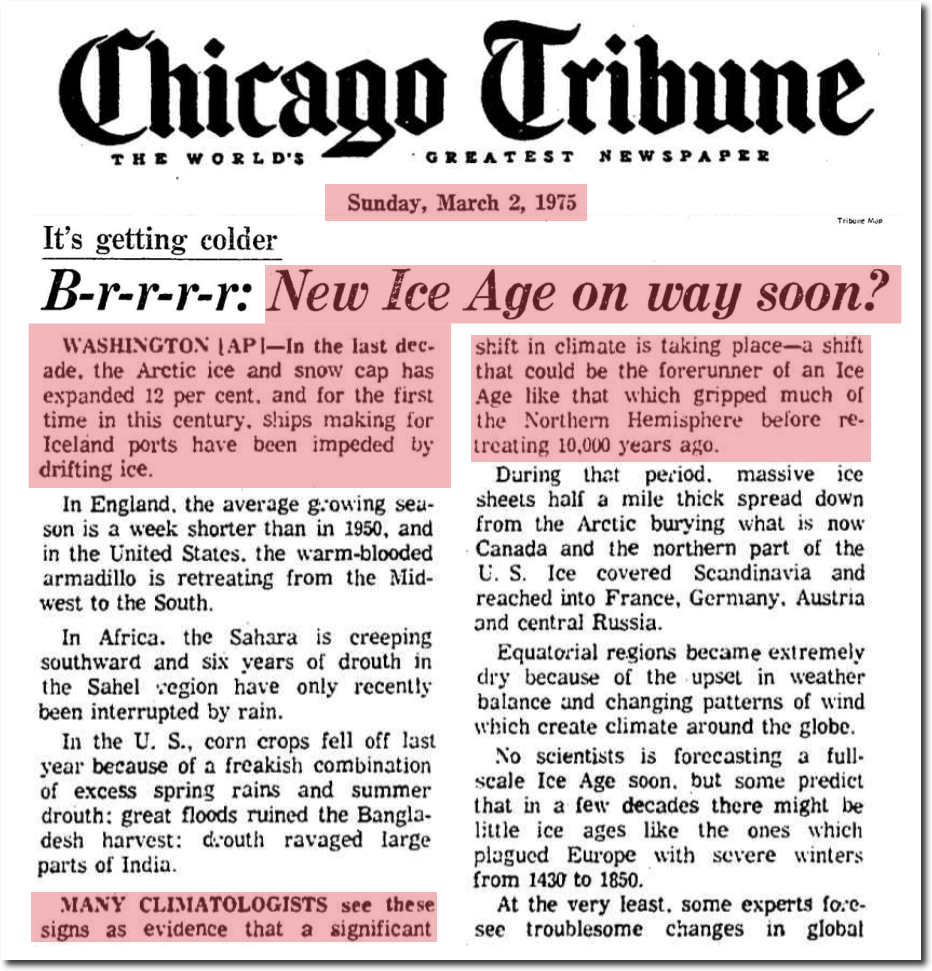
March 2, 1975 – B-r-r-r-r: New Ice Age on way soon? | Chicago Tribune Archive
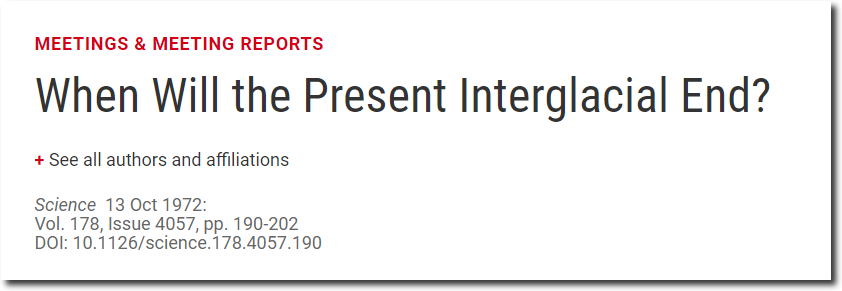
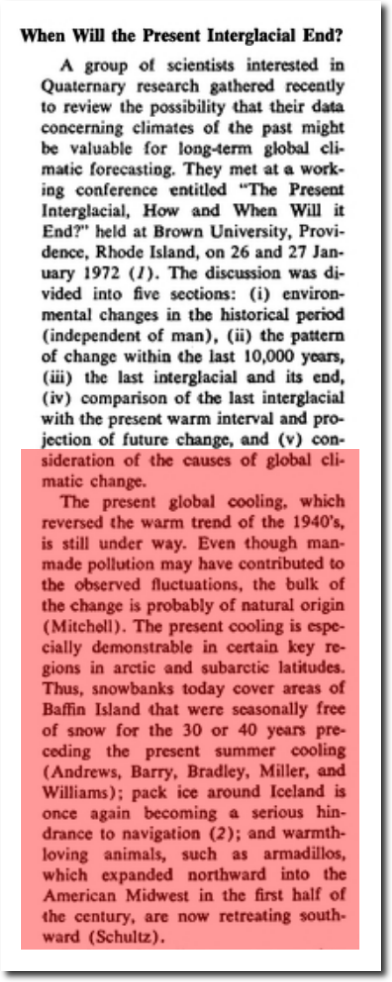
When Will the Present Interglacial End? | Science
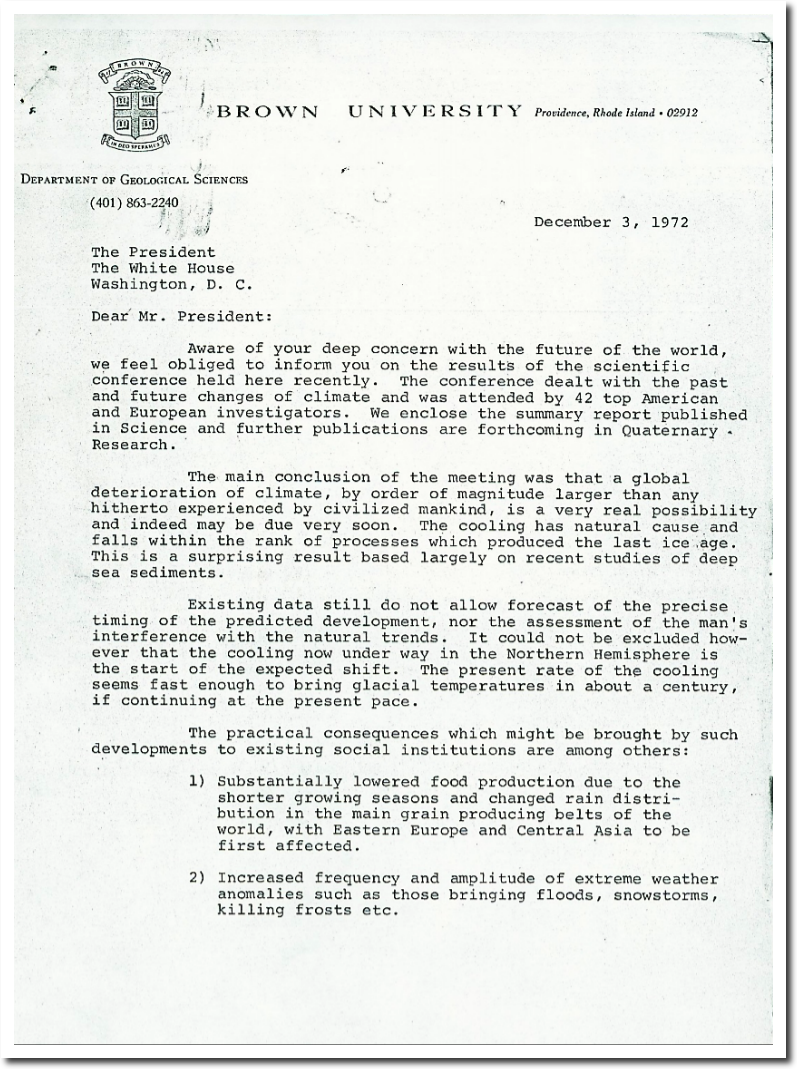
These top scientists sent a letter to President Nixon warning of a new ice age within a century.
THE ROLE OF NOAA’S CLIMATE PREDICTION CENTER IN THE DEVELOPMENT OF CLIMATE SERVICES
NOAA now pretends that time began in 1979, and that they don’t have any satellite data prior to the 1979 peak.
minimum sea ice extent at the end of summer 2016 tied with 2007 for the second lowest in the satellite record, which started in 1979.
ftp://ftp.oar.noaa.gov/arctic/documents/ArcticReportCard_full_report2016.pdf
The 1990 IPCC report showed some of the inconvenient data, which NOAA is now hiding. However, it did not show the 12% increase prior to 1972.
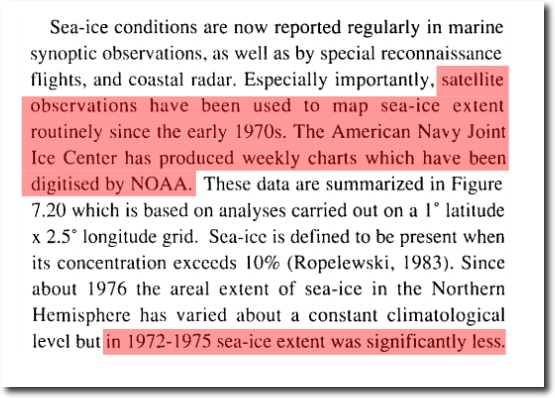
satellite observations have been used to map sea-ice extent routinely since the early 1970s. The American Navy Joint Ice Center has produced weekly charts which have been digitised by NOAA.
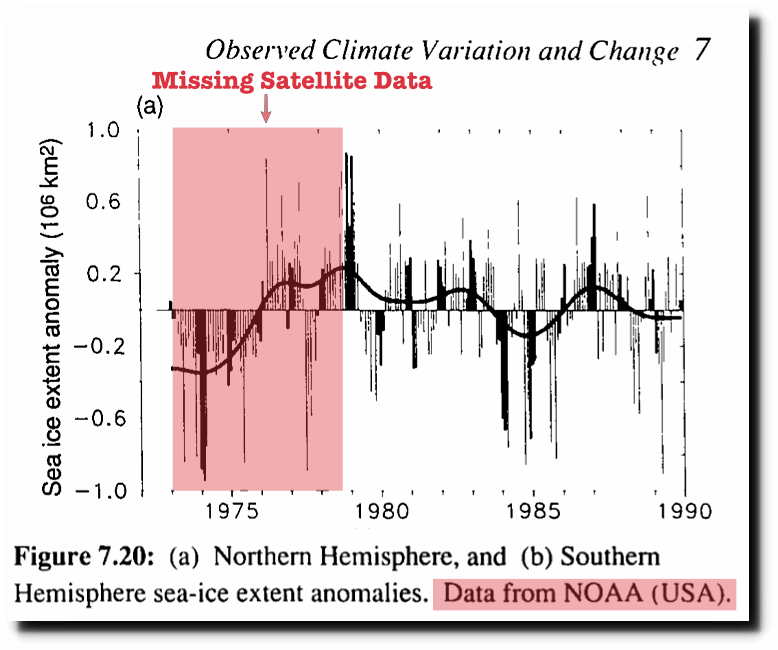
The 1985 DOE report (predecessor to the IPCC) showed sea ice extent was much lower in the 1950’s than it was in the 1970’s.

Projecting the climatic effects of increasing carbon dioxide (Technical Report) | SciTech Connect
Arctic sea ice is now about the same thickness (two meters) as it was sixty years ago, and sixty years later the New York Times is still making the same ice-free Arctic forecasts.
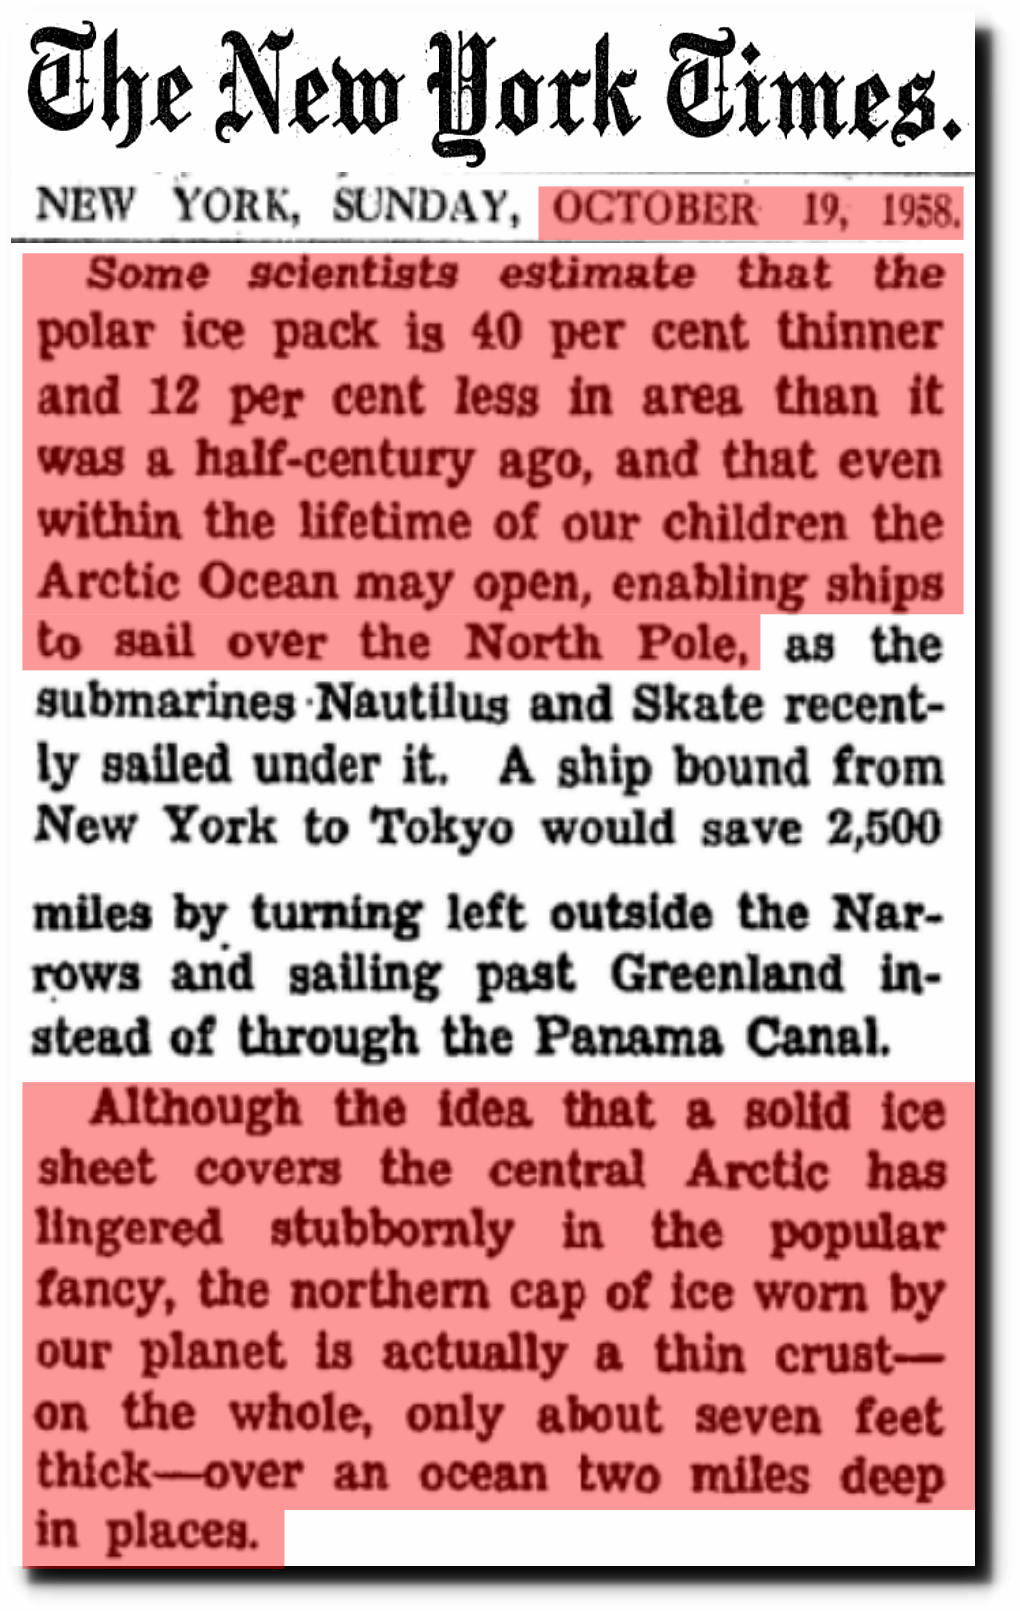
The Changing Face of the Arctic; The Changing Face of the Arctic – The New York Times
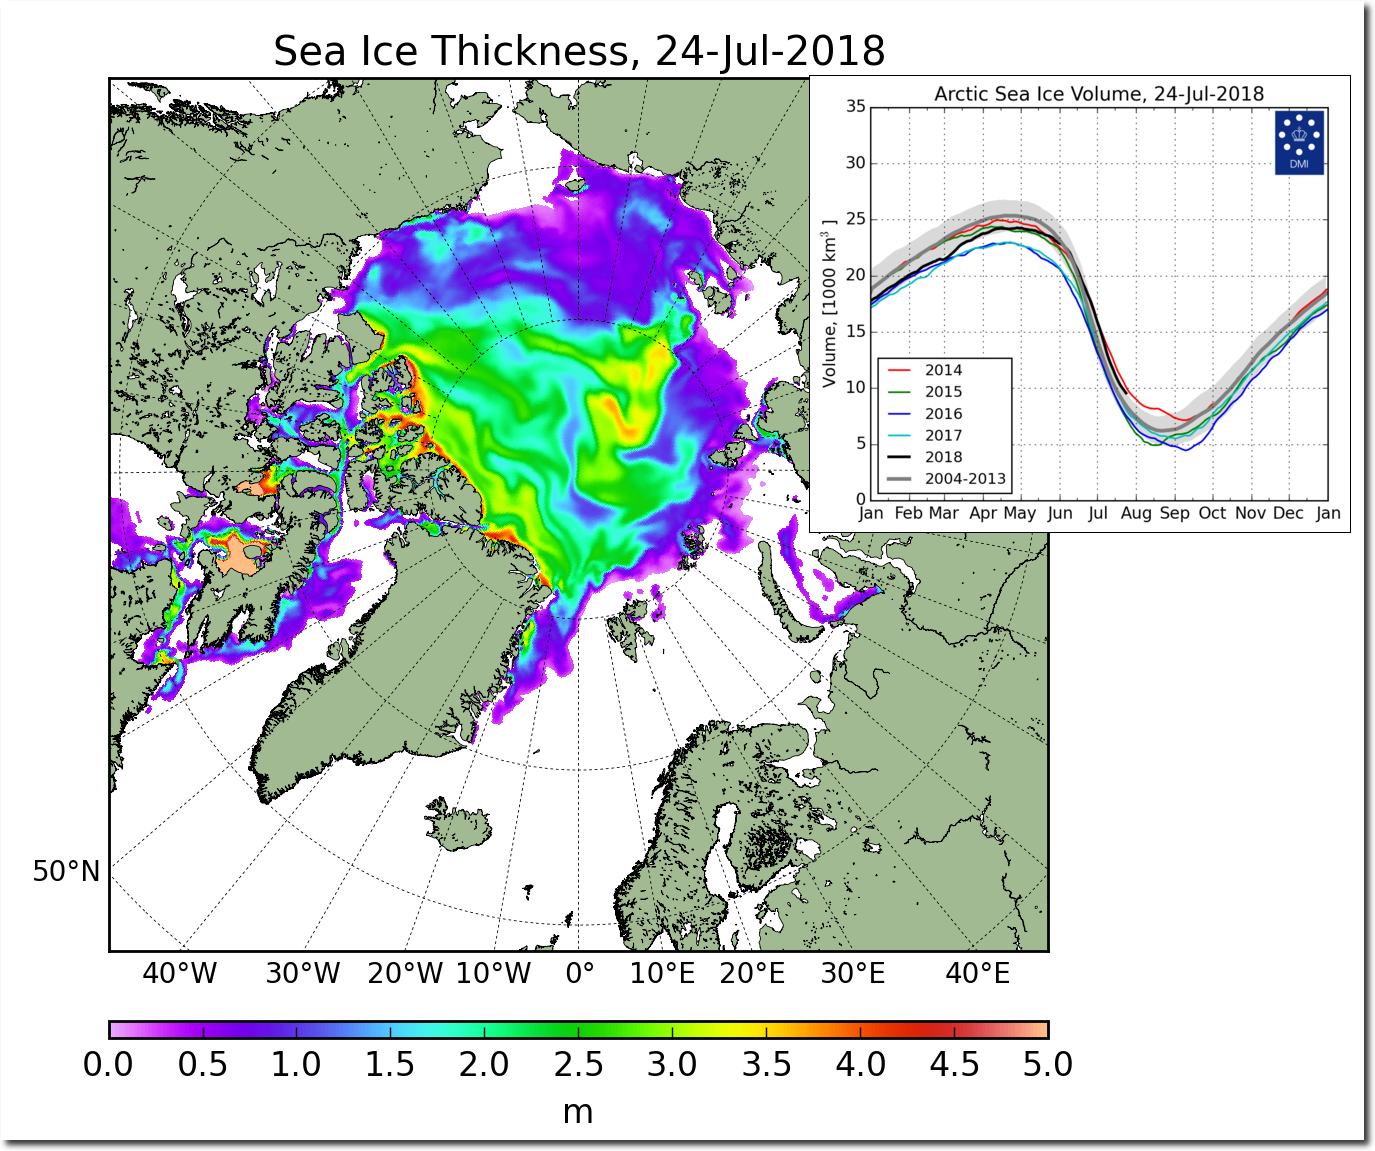
FullSize_CICE_combine_thick_SM_EN_20180724.png (1337×1113)
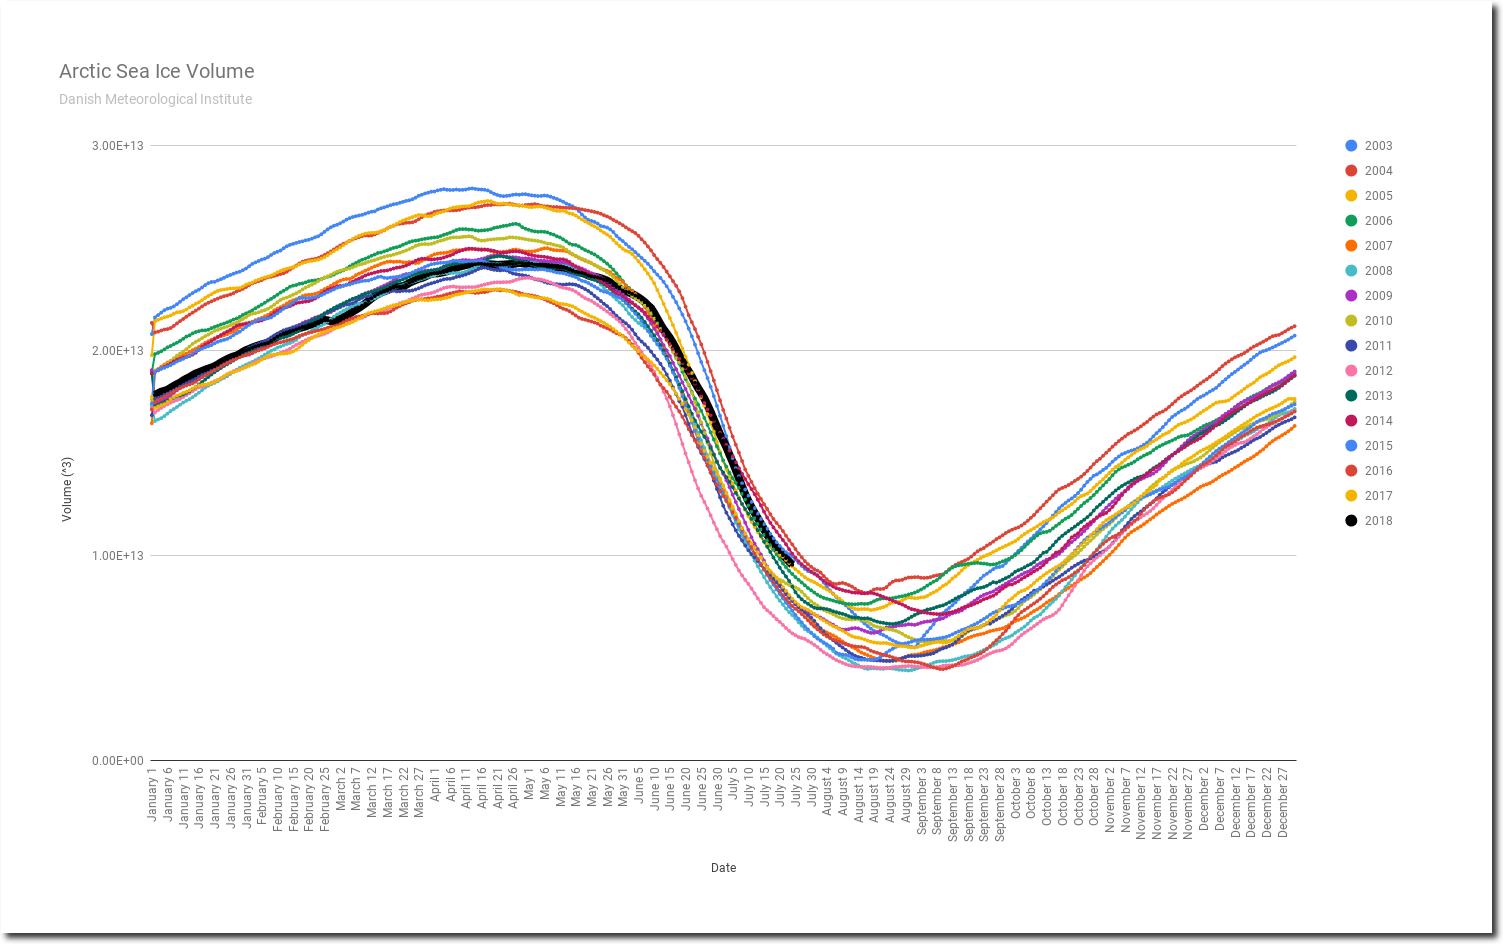
All of NOAA’s cheating and hiding data is about to unravel however. Arctic sea ice volume is fourth highest in the last 15 years.
And winter snow cover has continued to increase since 1967.
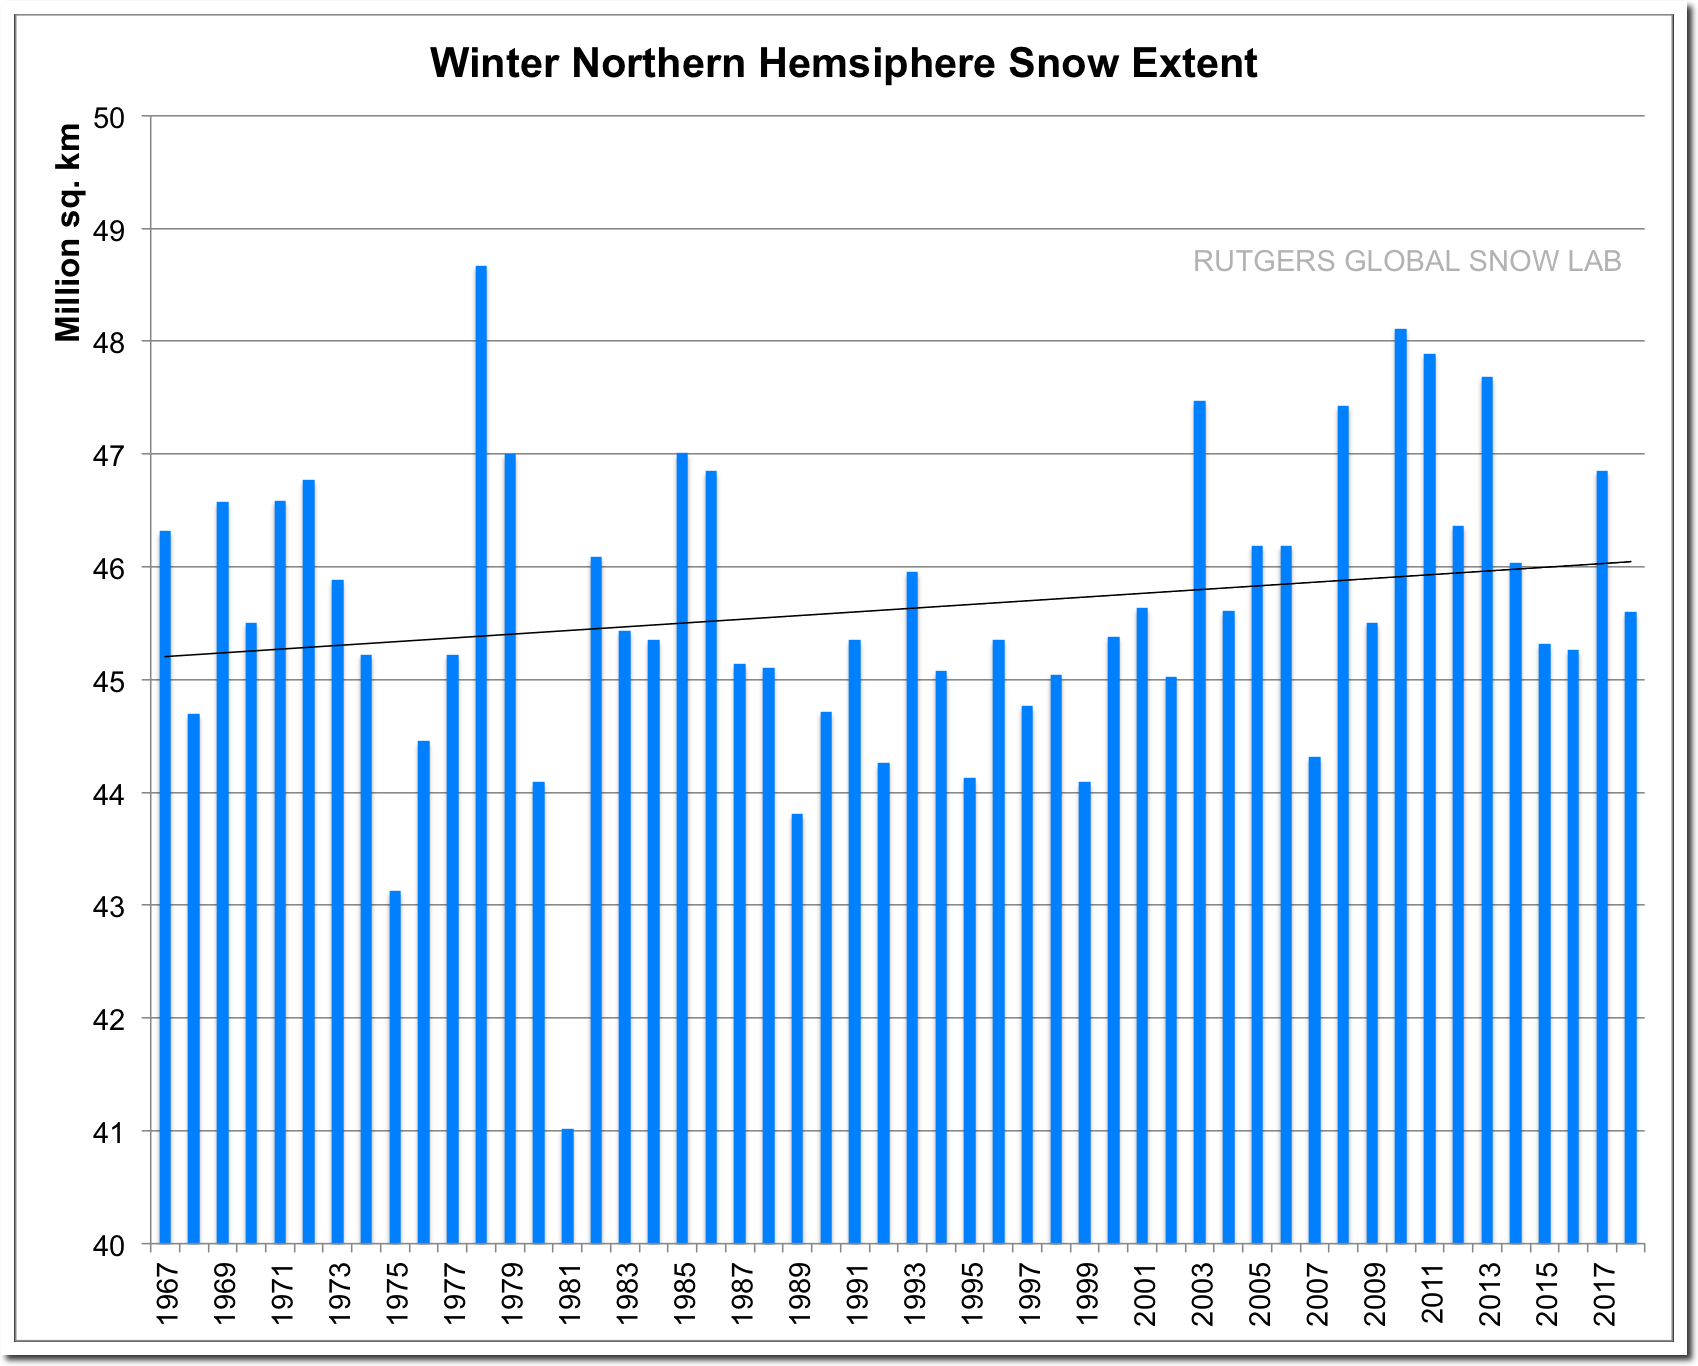
Rutgers University Climate Lab :: Global Snow Lab
Nothing is happening in the Arctic. The entire global warming scam is based on lies and data tampering. And most importantly rewriting history.