

Image: Towering firenado forms during factory fire in England (Video)
By Paul Homewood
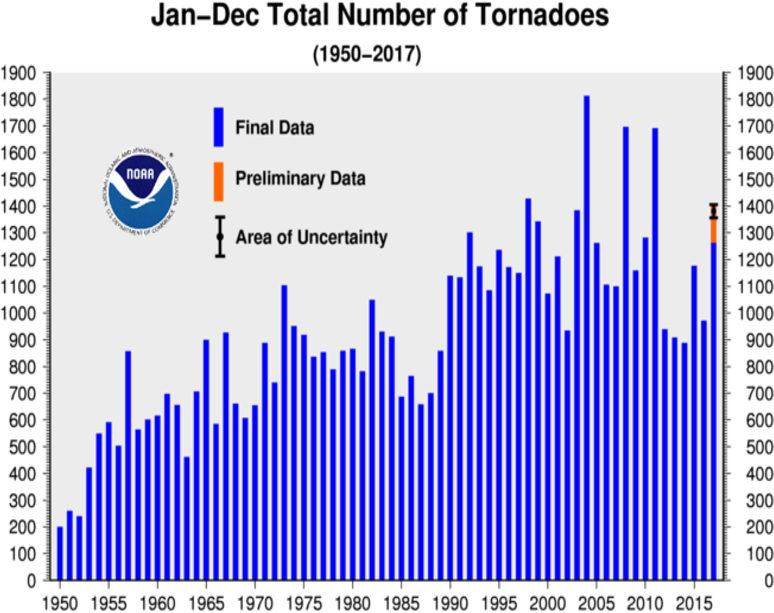
https://www.ncdc.noaa.gov/sotc/tornadoes/201713
As I’ve often commented, NOAA keep insisting on publishing charts of total tornado numbers, even though they know full well that these numbers are grossly misleading, and simply reflect the fact that more tornadoes get to be reported these days.
As McCarthy & Schaefer pointed out in their paper, “TORNADO TRENDS OVER THE PAST THIRTY YEARS”:
The increase in reported tornado frequency during the early 1990s corresponds to the operational implementation of Doppler weather radars. Other non-meteorological factors that must be considered when looking at the increase in reported tornado frequency over the past 33 years are the advent of cellular telephones; the development of spotter networks by NWS offices, local emergency management officials, and local media; and population shifts.
The growing “hobby” of tornado chasing has also contributed to the increasing number of reported tornadoes. The capability to easily photograph tornadoes with digital photography, camcorders, and even cell phone cameras not only provides documentation of many weak tornadoes, but also, on occasion, shows the presence of multiple tornadoes immediately adjacent to each other.
http://www.spc.noaa.gov/publications/mccarthy/tor30yrs.pdf
NOAA themselves state:
One of the main difficulties with tornado records is that a tornado, or evidence of a tornado must have been observed. Unlike rainfall or temperature, which may be measured by a fixed instrument, tornadoes are short-lived and very unpredictable. If a tornado occurs in a place with few or no people, it is not likely to be documented. Many significant tornadoes may not make it into the historical record since Tornado Alley was very sparsely populated during the 20th century.
Much early work on tornado climatology in the United States was done by John Park Finley in his book Tornadoes, published in 1887. While some of Finley’s safety guidelines have since been refuted as dangerous practices, the book remains a seminal work in tornado research. The University of Oklahoma created a PDF copy of the book and made it accessible at John Finley’s Tornadoes (link is external).
Today, nearly all of the United States is reasonably well populated, or at least covered by NOAA’s Doppler weather radars. Even if a tornado is not actually observed, modern damage assessments by National Weather Service personnel can discern if a tornado caused the damage, and if so, how strong the tornado may have been. This disparity between tornado records of the past and current records contributes a great deal of uncertainty regarding questions about the long-term behavior or patterns of tornado occurrence. Improved tornado observation practices have led to an increase in the number of reported weaker tornadoes, and in recent years EF-0 tornadoes have become more prevelant in the total number of reported tornadoes. In addition, even today many smaller tornadoes still may go undocumented in places with low populations or inconsistent communication facilities.
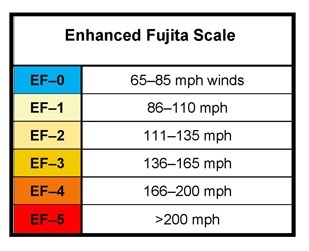
With increased National Doppler radar coverage, increasing population, and greater attention to tornado reporting, there has been an increase in the number of tornado reports over the past several decades. This can create a misleading appearance of an increasing trend in tornado frequency. To better understand the variability and trend in tornado frequency in the United States, the total number of EF-1 and stronger, as well as strong to violent tornadoes (EF-3 to EF-5 category on the Enhanced Fujita scale) can be analyzed. These tornadoes would have likely been reported even during the decades before Doppler radar use became widespread and practices resulted in increasing tornado reports. The bar charts below indicate there has been little trend in the frequency of the stronger tornadoes over the past 55 years.

https://www.ncdc.noaa.gov/climate-information/extreme-events/us-tornado-climatology/trends
To illustrate the reality, let’s first look at EF-0 trends.
EF-0 tornadoes typically have wind speeds between 65-85 mph
Using data from NOAA’s Storm Prediction Center, we can see how reports of the weakest tornadoes has effectively tripled since the 1970s, now accounting for over half of all tornadoes.

Although NOAA recommend discounting EF-0s, there is also evidence that we should also exclude EF-1s for the same reason.
Although the number of EF-1s has remained fairly flat over the years, the proportion of EF-1s has risen sharply since the 1970s:


We are left with a simply choice:
- Either more EF-1s are being recorded because of Doppler, etc.
- Or tornadoes are on average becoming weaker.
Interestingly NOAA also maintain a FAQ website for tornadoes. It includes this statement:
Tornado reports have increased, especially around the installation of the NEXRAD Doppler radar system in the mid 1990s. This doesn’t mean that actual tornado occurrence has gone up, however. The increase in tornado numbers is almost entirely in weak (EF0-EF1) events that are being reported far more often today due to a combination of better detection, greater media coverage, aggressive warning verification efforts, storm spotting, storm chasing, more developmental sprawl (damage targets), more people, and better documentation with cameras (including cell phones) than ever. Modern averages of roughly 1200 per year nationwide probably are as close to the truth as we’ve ever seen. Another few decades of well-documented tornadoes will tell us more. To compare tornado counts before Doppler radars, we have to either adjust historical trends statistically to account for the unreported weak tornadoes of before, or look only at strong to violent (EF2-EF5) tornadoes, whose records are much better documented and more stable. When we do that, very little overall change has occurred since the 1950s.
https://www.spc.noaa.gov/faq/tornado/index.html#Climatology
If we do that (look at EF-2-EF5s), we see a very clear declining trend:

Either way, whether tornadoes are becoming less frequent or weaker, it is good news, and the opposite of the relentless claims about extreme weather we keep hearing.
Ref.: https://notalotofpeopleknowthat.wordpress.com/2018/08/08/tornado-trends/
Quartz: Climate Studies Need Hot Weather to Persuade

Hansens’s 1988 testimony – the birth of the cap and trade temple
By Eric Worrall – WUWT
According to Quartz, proper stage management and timing is required to make climate studies persuasive.
To get people talking about climate change, publish your study during a hot summer
By Akshat Rathi
…
That said, there’s still a sizeable population on the planet that doesn’t care about climate change or, worse, denies it’s real. To turn those people around, some of the world’s most preeminent scientists have figured out it makes sense to publish global-warming studies when it’s hot outside.
It was the trick Jim Hansen, one of the world’s leading lights on climate change, used when he gave his now-famous testimony to the US Congress on a blistering hot day in June 1988.
…
The good news is that it’s not too late. “We as a global community can also manage our relationship with the system to influence future planetary conditions,” Katherine Richardson of the University of Copenhagen told the BBC. But it will require bold moves, such as switching to fully zero-carbon energy sources by mid-century, readying ways to suck carbon dioxide from the air, and maybe even consider solar geoengineering. All that, however, will require all of us to believe that the threat of global warming is real and deserves drastic action.
Read more: https://qz.com/1350565/the-hothouse-climate-change-study-is-big-news-thanks-to-the-heatwave/
Remember the fairy Tinker Bell from the story Peter Pan? In the story, every time someone says “I do not believe in fairies”, somewhere a fairy dies. The only cure was to clap loudly while reciting “I do believe in fairies” over and over, until the belief was strong enough to revive the dying fairy.
Now we have a field of science where everyone has to believe or it doesn’t work.
Every time someone says “I do not believe in climate change”, somewhere a sad climate scientist decides to write about their feelings. Perhaps if we all clap hands and recite “I do believe in the climate crisis”, we can make them smile again, and help save the world.
