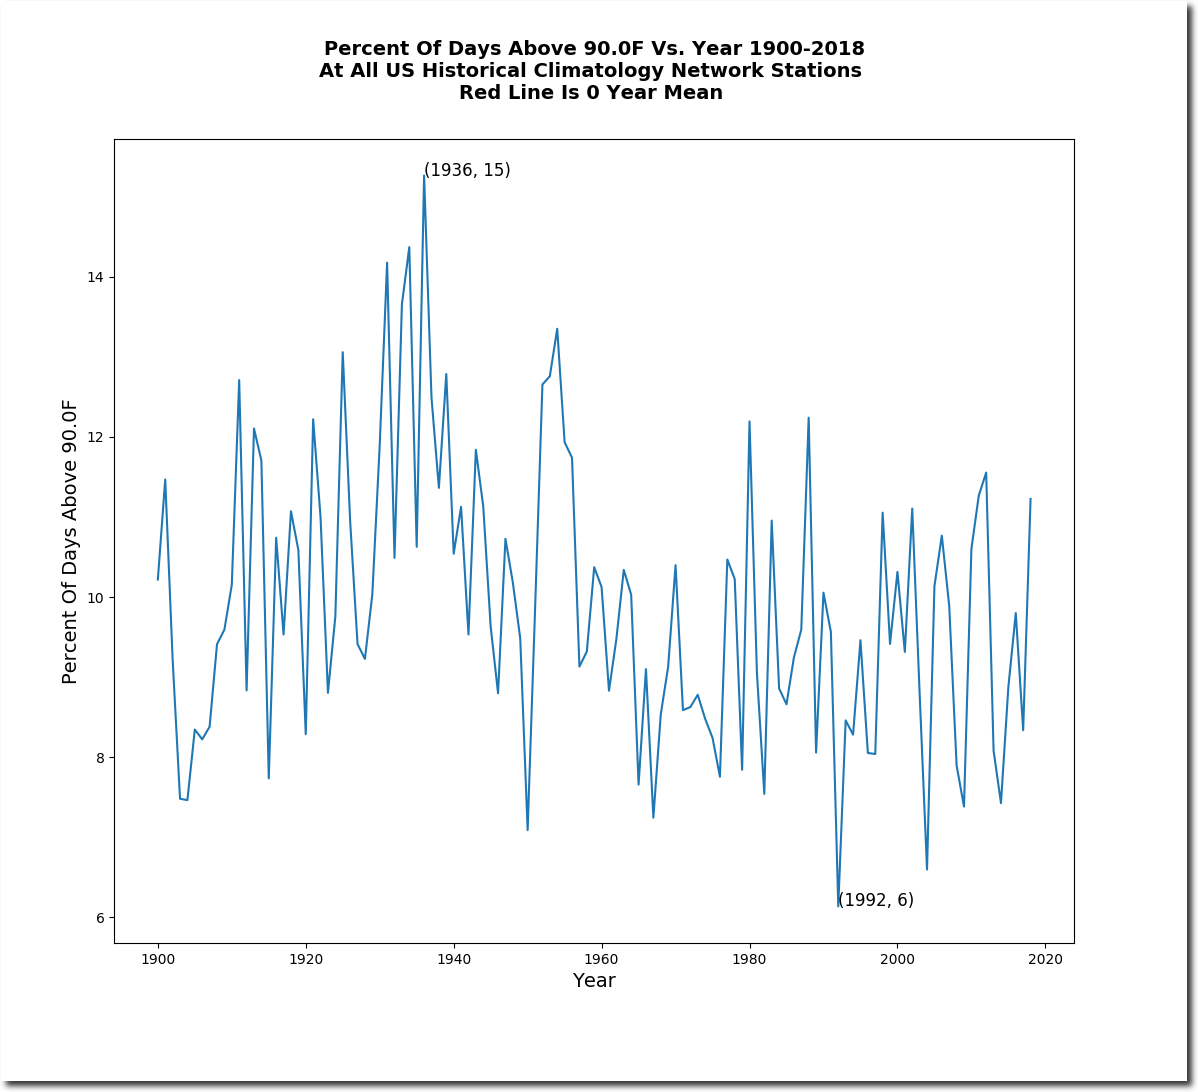
But somehow they lost the very hot summer of 1988, when James Hansen started the global warming scam, the Mississippi River nearly dried up, and Yellowstone burned.
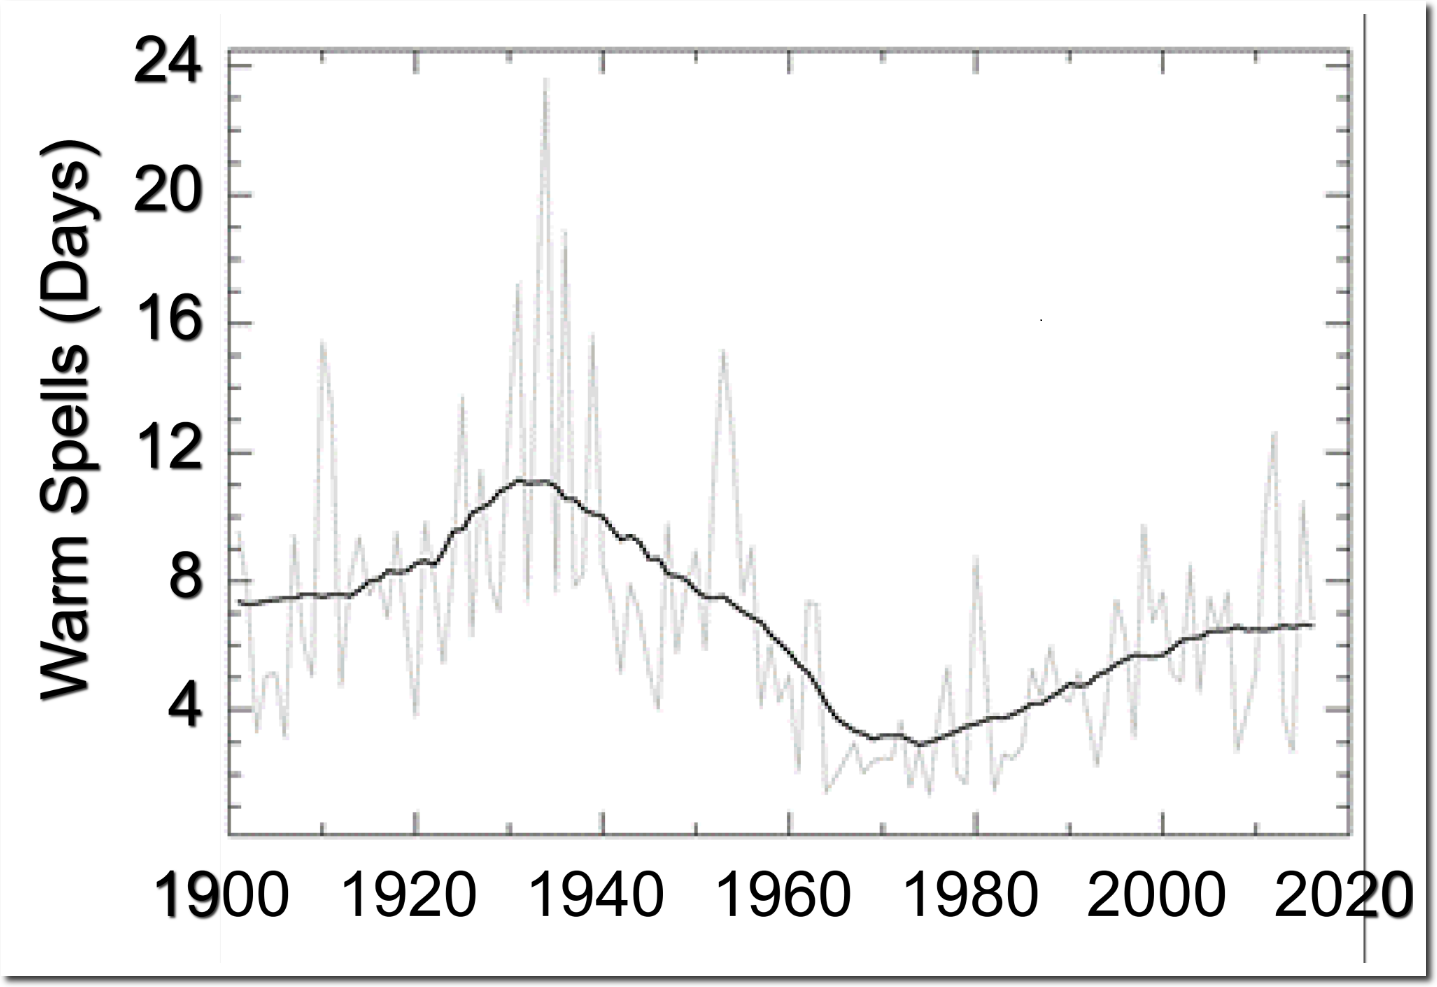
This is the actual data.
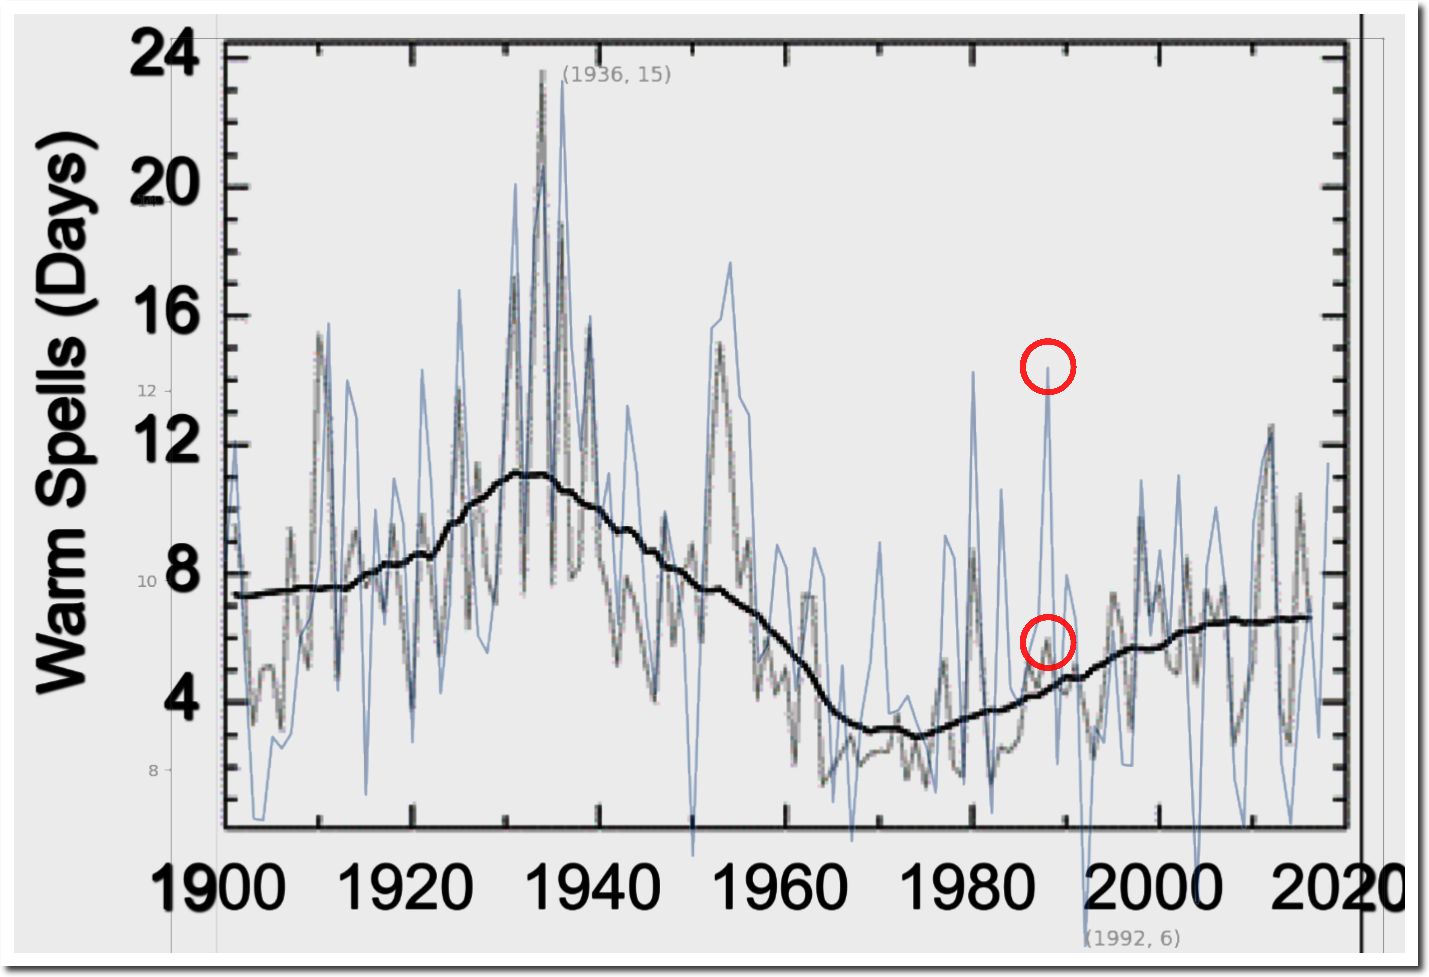
The next graph overlays the actual data above, on the government graph below. 1988 is gone – you really can’t make up incompetence like this.
71% of the earth is covered by ocean, water is a 1000 times denser than air and the mass of the oceans are 360 times that of the atmosphere, small temperature changes in the oceans doesn’t only modulate air temperature, but it also affect the CO2 level according to Henry’s Law.
The reason it is called “Law” is because it has been “proven”!
That means, the graph proves CO2 do not control temperature, that again proves (Man Made) Global Warming, now called “Climate Change” due to lack of … Warming is – again – debunked!