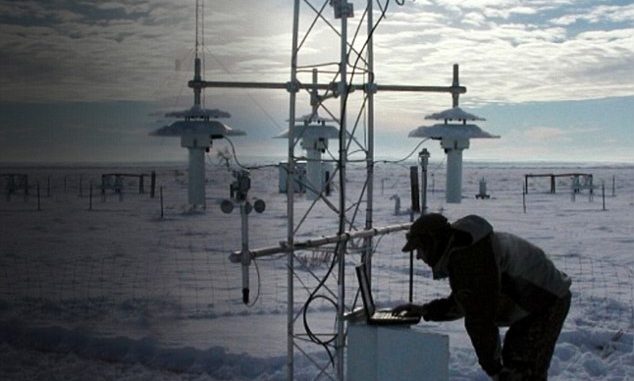
Image: Exposed: How world leaders were duped into investing billions over manipulated global warming data
By Leland Park
Given the impending global warming crisis declared by scientists, it should be easy to unambiguously demonstrate the crisis from the instrumental record. Unfortunately, when looking at the high temperature record for the US, it does not show any warming.
Figure 1 illustrates the incremental changes in surface air temperatures based on year to year differences in station average Tmax. The data is from all active stations in the US Historical Climatology Network (USHCN) from 1895 to 2014.
The classic heat equation defines changes in heat content as being proportional to changes in temperature (ΔQ = ƒ{ΔT} ).
Thus, Figure 1 amounts to a depiction of incremental changes in heat content, without scaling in energy units. The overall net temperature change is 0, which means the net change in heat content is also zero (ΔQ = ƒ{ΔT} = ƒ{0} = 0).
Figure 1 Year to Year Heat Changes (ΔT) for the USHCN
Despite substantial differences in prevailing temperatures across the network, the differencing method (use of ΔT) effectively normalizes them to variations about its trend. According to the USHCN Tmax records, that trend amounts to a norm of 0 deg F change, for all stations in the network.
According to the instrumental history, the average year to year differences in station Tmax values is relatively small, amounting to about +/- 2 deg F. This long-term pattern means;
A. There is no persistent warming or cooling trend across the US,
B. Heat changes are small across the entire network,
C. Climate behavior is resilient in maintaining norms – despite perturbations,
D. There is no net long-term change in the energy balance.
Interpretation notes;
1) Variations in values are the result of climate thermodynamics – not “noise”,
2) Heat changes are the result of all contributory sources, and 3) conclusions are for the US only – though thermodynamics would seem to rule out a global warming that left out the continental US.
The observational data shows no signs of an impending global warming crisis – not even in the “adjusted” versions. Conclusion are the same, whether all stations or any subset are aggregated for the analysis.
There are further clues to climate temperature stability awaiting discovery in the unadjusted USHCN data – for astute researchers willing to explore it. These discoveries include insights into climate thermodynamics as well as clues as to why the climate is resilient to change. Interested researchers should not delay, as maintenance of the datasets was abandoned after 2014, with no guarantee of future preservation.


