

By Joe Bastardi – CFACT
I want you to read this article:
Two points:
1) I will make the case for why such winters like this happen
2) I will point out that nowhere in this article did the massive natural physical drivers that far outweigh the effect of CO2, which is only .041% of the atmosphere. Pointedly, of which man is only responsible for 25% and the US only 15% of that total.
I am not going to waste time attacking here, except to say this kind of one-sided journalism and the fact that nowhere did anyone show what I am about to reveal to you, should raise questions of any objective person.
Basically the rules of the game are, if its warm like this winter, its climate change, if it is cold, its climate change. It is typical of everyone gets a trophy in that any answer even if opposite, means you get credit.
Water vapor is by far the most important greenhouse gas when it comes to the planetary weather and climate. Meteorologist look at “saturation mixing ratios” which show a correlation of water vapor to temperature. Basically the colder and drier the air mass, the more the introduction of water vapor will lead higher temperatures, there is no place like the arctic to prove this is the case. The cyclically warmed oceans have put more water vapor (and CO2) into the air. When Super El Niño’s go off, the immense amounts dispersed lead to a step up of the temperature. The colder regions leading the way as will be opined on below.

Now look at the table below. Notice how small the correlated increase of WV is between -40 and -30 ( less than .1gram/kg). The introduction of those slight amounts create clouds, cause lower pressure and more turbulent mixing. All of which act to increase temperatures where its very cold. (Also in the high levels of the atmosphere, which is why the “trapping hot spot theory of warming in the upper levels over the tropics has gone the opposite way. ITS DRYING OUT NOT GETTING MORE MOIST). While its true this creates a distortion in the global temperature pattern, this is inherent in the system anyway. Notice at higher temperatures it takes much more water vapor to correlate to the temperature increase.

So look at the warming in the arctic:

Now watch this. I had a forecast for a colder than normal winter (1-3 below average with wide swings back and forth) over the heartland. The reason was based on SST models that revealed the classic warm ring in the Pacific from east of the dateline, northeast to off the west coast of the US then back up into the NE Pacific.

Such a pattern favors a western Canadian ridge, and when the area just east of the dateline is warm and off south America is not as warm, cold flows into the center of the nation and tries to spread out. Models are tricky things as was discussed in my last blog. But SST forecasts are usually better because the ocean is so slow to change. So put heartland cold into the pattern, and have warm water in the Gulf and off the east coast, you have the formula for a wild winter, worse in the middle and end than at the start. So we blend them and use them and have done quite well in past years, not this winter for look at what happened:

That warm water in area 1 favors enhanced thunderstorms and the release of heat in the upper levels in a way that changes the pattern in the Pacific. If we look at the Madden Julian Oscillation, we see that favors a phase 6. Notice where the heavy precipitation is in the winter in phase 6

Look at this winter almost right on top of it.

What does a mean phase 6 give us for the US temperature-wise?

But wait there is more. If we take the last 4 very warm winters

..and looked at the upper air pattern, we notice a powerfully positive arctic oscillation (for the sake of ease, severe cold over the pole),

we see a positive eastern Pacific oscillation. Cold in Alaska, ridging north of Hawaii. This in turn forces ridging over the eastern US which is then fed by very warm water as it prevents cold intrusions, the ridging over Europe where it was quite warm and in much of Russia. What did we see this year?

Almost exactly that. The phase 6 look feeds heat into the ridge NNE of it. This, in turn, tightens the upper air jet due to increased gradients. Sinking air southeast of the main jet feeds the ridge, rising air northeast of the main jet helps intensify the trough. Once the feedback starts, with the SST not as warm on the west coast, it means what trough there is, tries to go into the west, not the Great Lakes. That in turn also allows the ridge to feed back in the southeast and the pattern repeats itself until such time the seasonal change or other large scale events can change it. Now look up there to compare and contrast that to the “snowmageddon” winter where heavy snow amounts were being blamed on “climate change”.

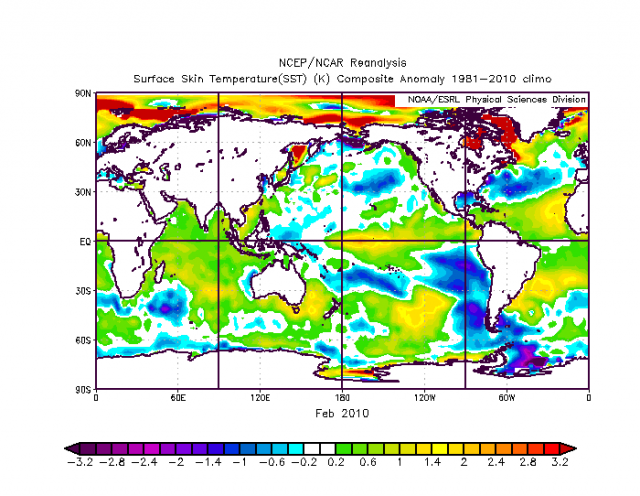
Think back to that winter. After the big December, snowstorm winter disappeared till the last 10 days of January then February went wild. Notice where that oscillation was in February 2010 (green) mainly in phase 8 certainly not in 6 (it was for a little while in January and it was mild).

Now notice where the center of the heavy precip was in Feb 2010..

..to the east not west of the dateline. That had to do with the SST centering of the warmth just east of the dateline. Warmer than what it is off South America and SST’s off the west coast warmer than what they are further west. The cold water off the east coast was a factor.
I always have to say, give people the why before the what, and in this case the great lesson is SST models can not be trusted all the time. Again, they are usually better. (BTW they are forecasting a La Niña next winter, which should lead to a reduction in overall global temperatures but not back to where they were before the SUPER El Niño and a whole new set of problems with that forecast.) But I have to question the messenger when the entire message is not given. In this case, even the novice can link this together and see that this winter had NATURES THUMBPRINT ALL OVER IT. At the very least there is plenty of reason to believe that this winter, like the other ones shown, is simply nature doing what nature does. No matter what CO2 does, get the same pattern and the same thing will happen. How does the increase since the 2009-2010 winter of 15ppm of CO2 lead to the opposite effect? Yet both are a sign of climate change. When any answer will do, its no answer at all.
Ref.: https://www.cfact.org/2020/03/30/extra-warm-us-winter-had-natures-thumbprint-on-it/
In short, if CO2 was responsible, 1. It would happen every year and, 2. The warming would be uniform and as strong in winter AND in summer.
