

Fort Valley, Arizona had daily temperatures recorded every day during summer 1990. NOAA declared the data to be missing, and bumped the temperature up by 0.64C (1.16F)
The USHCN adjusted monthly data shows summer 1990 as missing
and 27.06C
USH0002316011990 623EX 620EX 1168EX 1613EX 2016EX 2872EX 2711EX 2536EX 2312 1916 1284a 542a

THE USHCN Raw monthly data shows it present and 26.42C
USH00023160 1990 557 601a 1083 1528a 1917 2812 2658 2456 2212 1816 1182a 432a


The USHCN Daily data shows temperatures recorded every day
that summer, and 26.42C
USC00023160199006TMAX  194  0  250  0  289  0  294  0  289  0  267  0  272  0  294  0  267  0  211  0  222  0  244  0  239  0  233  0  211  0  228  0  261  0  278  0  278  0  283  0  317  0  322  0  333  0  333  0  339  0  339  0  333  0  339  0  339  0  339  0-9999
USC00023160199007TMAX  333  0  294  0  261  0  294  0  267  0  267  0  206  0  222  0  233  0  267  0  289  0  300  0  267  0  256  0  222  0  250  0  261  0  267  0  300  0  283  0  261  0  261  0  256  0  239  0  233  0  244  0  267  0  283  0  289  0  306  0  261  0
USC00023160199008TMAX  261  0  228  0  256  0  283  0  261  0  267  0  267  0  289  0  294  0  294  0  283  0  278  0  178  0  133  0  161  0  194  0  233  0  233  0  211  0  222  0  233  0  244  0  244  0  233  0  233  0  256  0  267  0  261  0  289  0  289  0  239  0
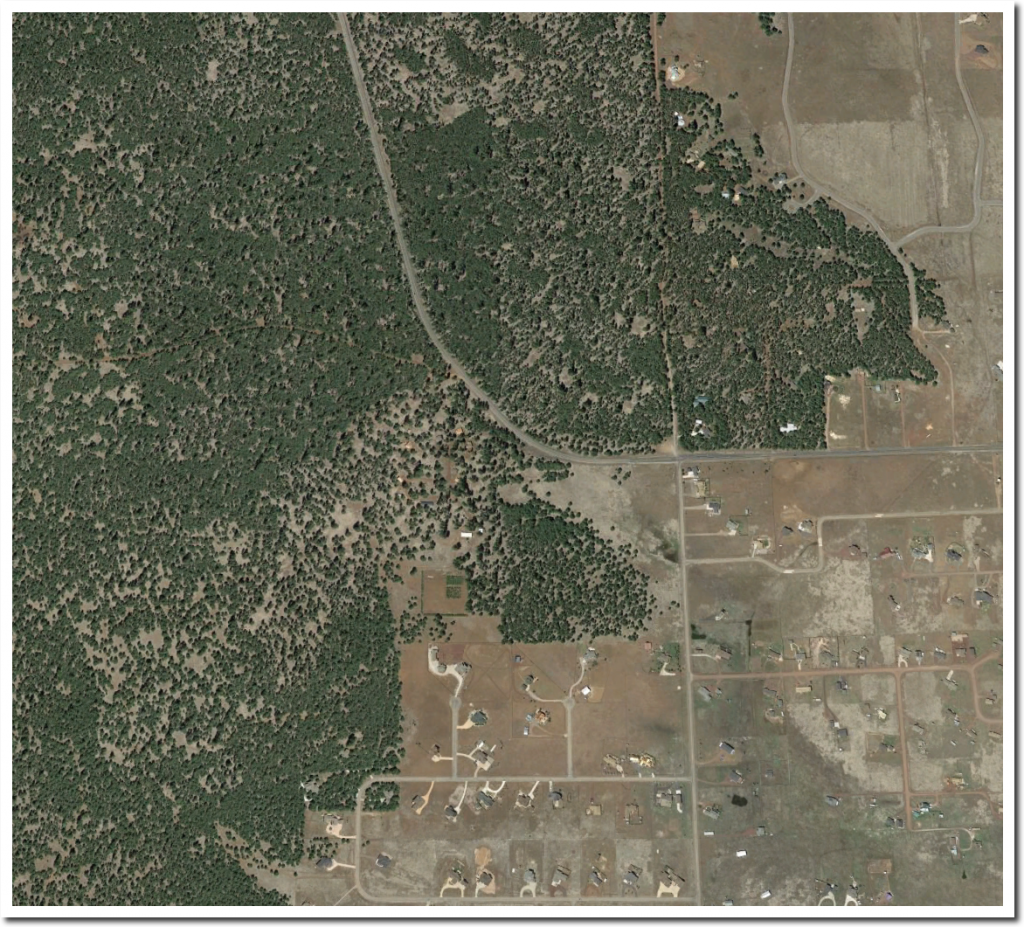
Fort Valley is a very rural US Forest Service research station near Flagstaff, and is as well sited as a thermometer can be.
NOAA declared two thirds of the recorded daily data at Fort Valley, Arizona from 1990 to be missing, and replaced them with fake higher temperatures
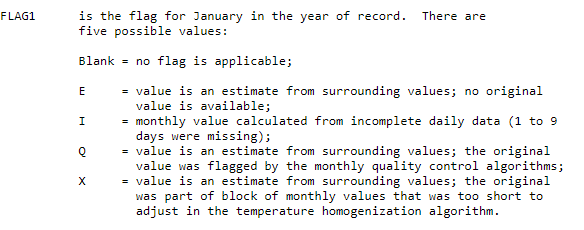
ftp://ftp.ncdc.noaa.gov/pub/data/ushcn/v2/monthly/readme.txt
How could they possibly think they would get away with this?
Ref.: https://realclimatescience.com/2017/08/another-smoking-gun-of-noaa-fraud/
Related
Pre-Industrial And Current CO2 Levels Deliberately Corrupted.
I’ve told this story before but it requires repeating because of awareness of climate science corruption. Even skeptics realize claims of incompetence are inadequate. Official Intergovernmental Panel on Climate Change (IPCC) climate science was completely orchestrated for a premeditated result. T.R.Wigley’s 1983 paper “The pre-industrial carbon dioxide level” was pivotal in the evolution of climate science corruption. It was a flawed paper that cherry-picked data to claim pre-industrial CO2 level was 270 ppm. G.S. Callendar did the same thing (diagram), as Zbigniew Jaworowski illustrated in a paper to a 2004 US Senate Committee.

There are 90,000 samples from which Callendar selected a few. Notice they also change the slope of the trend, to show a steady rise from 1750.
Results were required to prove the IPCC claim.
“Global atmospheric concentrations of carbon dioxide, methane and nitrous oxide have increased markedly as a result of human activities since 1750 and now far exceed pre-industrial values determined from ice cores spanning many thousands of years.”
Ernst-Georg Beck confirmed Jaworowski’s work.
Modern greenhouse hypothesis is based on the work of G.S. Callendar and C.D. Keeling, following S. Arrhenius, as latterly popularized by the IPCC. Review of available literature raise the question if these authors have systematically discarded a large number of valid technical papers and older atmospheric CO2 determinations because they did not fit their hypothesis? Obviously they use only a few carefully selected values from the older literature, invariably choosing results that are consistent with the hypothesis of an induced rise of CO2 in air caused by the burning of fossil fuel.
Ice cores provide the historic record and Mauna Loa the recent. Both were designed to produce a smooth linking curve of increasing CO2.
Initially, Antarctic ice cores were ‘proof’ of CO2 creating temperature increase and low pre-industrial levels. Then we learned temperature increase preceded CO2 increase and levels were similar to today. The former was widely accepted and contradicted the major assumption of the hypothesis, so recently Shakun et al tried, unsuccessfully, to reassert the claim. The latter claim was contradicted by Jaworowski but essentially ignored.
“The basis of most of the IPCC comin 300 euron Casino Euron bonuksen, nautit varmasti eraista netin parhaista hetkista kasinopeleja pelaillen. conclusions on anthropogenic causes and on projections of climatic change is the assumption of low level of CO2 in the pre-industrial atmosphere. This assumption, based on glaciological studies, is false.”
In climate science, vehemence of personal attacks are directly proportional to the truth of the claim and qualifications of the author. Jaworowski’s attacks were nasty and unrelenting.
Glaciers, develop when snowfall survives summer melt and layers accumulate. Gradually snow changes to ice from heat and pressure of additional layers. This creates two larger layers divided by the firn-ice transition. On top is the brittle layer where cracks (crevasses) form and below the plastic layer where ice flows and annual layers blend and are deformed. In an understatement Wikipedia says,
“Dating the air with respect to the ice it is trapped in is problematic.”
and
“Trapping depth varies with climatic conditions, so the air-ice age difference could vary between 2500 and 6000 years.”
Dating errors, critical in climate science, occur with different methods.
“Five different dating methods have been used for Vostok cores, with differences such as 300 years at 100 m depth, 600yr at 200 m, 7000yr at 400 m, 5000yr at 800 m, 6000yr at 1600 m, and 5000yr at 1934 m.”
How much climate change occurs in 5- 6000 years?
Other problems with the ice cores include meltwater moving through the ice; Bacteria in the ice releasing gases even in 500,000-year-old ice at great depth; and contamination and losses during drilling and core recovery process. Jaworowski wrote,
“Until 1985, the published CO2 readings from the air bubbles in the pre-industrial ice ranged from 160 to about 700 ppmv, and occasionally even up to 2,450 ppmv. After 1985, high readings disappeared from the publications.”
Beck found,
“Since 1812, the CO2 concentration in northern hemispheric air has fluctuated exhibiting three high level maxima around 1825, 1857 and 1942 the latter showing more than 400 ppm.”
Here is his plot comparing 19th century readings with ice core and Mauna Loa data.

The ice core record is shown as a smooth curve achieved by eliminating extreme readings and applying a 70 year smoothing average. Eliminating variability is done with the Mauna Loa and all current atmospheric readings, which can vary up to 600 ppm in the course of a day. Information is lost with smoothing. Elimination of high readings prior to smoothing makes loss greater. Statistician William Briggs says you never smooth a time series.
Beck explained that Charles Keeling established Mauna Loa readings using the lowest afternoon measures. Beck notes
“Mauna Loa does not represent the typical atmospheric CO2 on different global locations but is typical only for this volcano at a maritime location in about 4000 m altitude at that latitude.”
Keeling’s son now operates the facility and,
“owns the global monopoly of calibration of all CO2 measurements.”
He’s also co-author of the IPCC reports based on his readings.
Another CO2 measurement provides evidence of smoothing effects and artificially low readings. Stomata, small openings on leaves, vary directly with atmospheric CO2 levels. Stomata records compared with ice core record for a 2000-year period illustrates the issue.

Stomata readings are higher with greater variability as Jaworowski and Beck assert.
Pre-industrial CO2 level was not lower than current levels and both are low in the entire geologic record. Climate models assume pre-industrial levels were lower and CO2 increase causes temperature increase. IPCC predictions are consistently wrong because falsified data and incorrect assumptions produce inaccurate results, but that was their goal.
