

The MWP must have been warmer than today, also longer, global and the CO2 level must also have been higher than today (because it was warmer and heat makes CO2 outgas from the oceans according to Henry’s Law).
Forests doesn’t die just because of low temperature. Here in Norway we had a forest on the Hardanger Vidda a 1000 years ago, we can still see the roots of the trees. However trees also die when there’s not enough CO2 in the air, like the situation is at elevated locations today. The fact there was a forest at that altitude a 1000 years ago proves CO2 level was higher.
What’s govern global temperature is longer cycles of solar activity, Milankovich cycles, cosmic rays and cosmic location and events. Such events influence the whole globe, not local temperature, besides, there’s no logic in that only Europe would experience a prolonged warming period of several 100 years.
R. J. L.
By Denis Ables
The proponents of anthropogenic-caused global warming invariably, (and ironically) DENY that the Medieval Warming Period (MWP, 1,000 years ago) was global and also likely warmer than it is now.
These alarmists acknowledge only that Europe experienced the MWP. (They had no choice – climate in that region is too well documented!) They apparently take this unjustifiable position because their computer models cannot explain a global, warmer MWP.
Their computer models require an increasing carbon dioxide (CO2) level, plus depend even more egregiously on yet another ASSUMPTION that water vapor feedback is the actual culprit, causing 2 to 3 times the temperature increase brought on by the increase in CO2. However, CO2 did not begin increasing until about the mid 1800s.
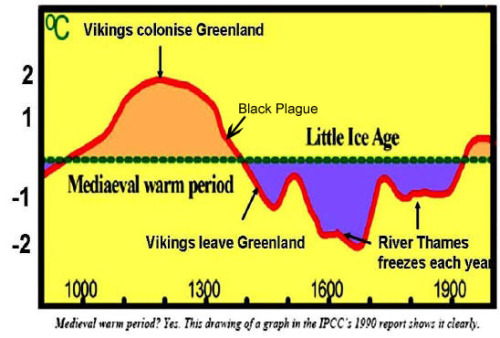
[The MWP graph above featured in an early UN IPCC report]
The global temperature increase during the MWP could not have been influenced by CO2 because there was no increase in CO2, not during the MWP, nor for thousands of years before the MWP. The danger for alarmists is that it then becomes plausible that our current warming (such as it is) might instead also be due to NATURAL climate variation. That, of course, conflicts with Mann’s hockey stick graph as well as with the other usual suspects, all of whom claim that our current warming is mostly due to increased CO2 level brought on by human activity.
However, it’s easy to show that the MWP was both global and at least as warm as now. While that proves nothing about the cause of our current warming (such as it is) it speaks loudly about the credibility of the folks who DENY that the MWP was global and at least as warm as now.
A brief meta-analysis, in effect a global study, follows, which makes use of numerous peer-reviewed studies, as well as other easily accessible data. The analysis demonstrates that the MWP was global and at least as warm as it is now.
First, the MWP trend is conclusively shown to be global by borehole temperature data. No controversial models needed, the data speaks for itself. The 6,000 boreholes scattered around the globe are not constrained to locations where ice core data has been used. A good discussion of the borehole data can be found at Joanne Nova’s website.
http://joannenova.com.au/2012/11/the-message-from-boreholes/
Next, the receding Mendenhall glacier (Alaska, pictured) recently exposed a 1,000-year-old shattered forest, still in its original position. No trees (let alone a forest) have grown at that latitude anywhere near that site since the MWP. It was obviously significantly warmer at that latitude anywhere near that site. Alaska is quite distant from Europe.

Finally, there have been hundreds of peer-reviewed MWP studies around the globe, with investigation results showing each site to have been warmer during the MWP than at the time of the study, and that result was reflected in earlier IPCC reports.
Since then confirming research continues to show up regularly, although apparently also ignored by the usual suspects. The MWP studies were carried out around the globe by investigators and involved organizations representing numerous countries.

It’s curious that Michael Mann (pictured) and his cohort did not give more consideration to the existing studies at that time before presenting their conflicting “hockey stick” claim, particularly given the controversial process employed in Mann’s “analysis”. One of the well-known alarmists, Phil Jones, admitted publicly that if the MWP was global and as warm as now then it’s a “different ballgame”. (But apparently neither Jones nor Mann, nor other alarmists, have bothered to review that data.) Peer-reviewed MWP studies continue to regularly show up, confirming the earlier studies, that the MWP was at least as warm as now.
The numerous MWP studies have been cataloged by the co2science.org website. Dr. Idso, the proprietor of that website, is a known skeptic. However, the peer-reviewed studies were independently performed by numerous researchers who not only represented many different countries but also used a variety of temperature proxy techniques. Dr. Idso is merely operating as a librarian.
One such example, the Greenland MWP Temperature (gisp2) study (which can be googled) shows, among other things, that Greenland was warmer during the MWP than it was at the time of that relative recently study. Note also that Greenland is distant from both Europe and Alaska. Another separate link to that study follows:
https://junkscience.com/2018/06/study-ancient-greenland-was-much-warmer-than-previously-thought/
Interested readers who are skeptics should be able to satisfy themselves by going to co2science.org and choosing (say) a half-dozen regions (all should be remote from each other and from Alaska, Greenland, and Europe). Focus on the subset of the MWP studies which directly address temperature. Choose at least one temperature study from each selected region. (Idso provides brief summaries but you can also review the original study.) You will find that each of the selected study sites was found to be warmer during the MWP than at the time of the study. Furthermore, these study results are consistent with the temperature trend exhibited by the borehole data. Conversely the peer-reviewed studies, in aggregate, confirm the global borehole data trend.
There are also other confirming observations which include such things as antique vineyards found at latitudes where grapes cannot be grown today, old burial sites found below the perma-frost, and apparently Viking maps of most of Greenland’s coastline. The link below is to a separate recent report, which references various studies, showing that South America also experienced the MWP.
The meta-study presented here is an aggregate of straightforward peer-reviewed studies, any of which can be replicated and the research results do NOT require the use of controversial “models”, nor dubious statistical machinations.
One of the “talking points” posed by alarmists attempting to “rebut” the global, warmer MWP is their claim that warming in all regions during the MWP must be synchronous. Obviously the MWP studies were generally performed independently, so the start and end dates covered by each MWP study will likely vary.
However, anyone foolish enough to accept that “synchronous” argument must be prepared to admit that our current warming would also not qualify as a global event. For example, many alarmists make reference to the 1800s when talking about the total global warming temperature increase. However, that span ignores a three decade GLOBAL cooling period from 1945 to 1975. In fact, that globally non-synchronous period is much more significant than just a region or two showing little or no temperature increase.
There are also other good reasons to exclude consideration of temperature increases during the 1800s. There was a significant NATURAL warming beginning around 1630 (the first low temperature experienced during the Little Ice Age), according to Dr. David Evans, (Joanne Nova website) and that period of naturally increasing

temperatures continued up to (and beyond) 1850, at which time CO2 began increasing. But it would have taken many subsequent decades, possibly more than a century, for CO2 increase after 1850, at an average 2 ppmv per year, to accrue sufficiently before having any impact on temperature measurements. Neither is there any reason to expect that the two centuries of natural and significant warming beginning in 1630 ended abruptly, after 2 centuries, merely because CO2 level (a trace gas) began increasing in 1850 at a miniscule 2ppmv per year. Also, how much, and for how long was the temperature increase after 1850 due mostly to the continuing natural climate warming beginning in 1630?
In regard to the “synchronous” argument, any current considerations about global warming must be constrained to a starting point AFTER the 1945-1975 cooling. The global temperature began steadily increasing in 1975 and that increase basically terminated during the 1997/98 el Nino. Even the IPCC (a bureaucracy which cannot justify its mission if our current warming is NATURAL) has acknowledged a GLOBAL “hiatus” in temperature increase after 2000. This admission conflicts with the well-known fact that CO2 level has steadily increased since around 1850. Where did that missing heat go?
So, our current “global warming” controversy involves basically two decades, (1975 to 1998) and that warming has been followed, by almost another two decades of no further statistically significant increase in temperature. But wait … ! It turns out that even the period from 1975 to 1998 apparently does not qualify as a global warming period because there were numerous “out of synch” regions and/or countries which experienced no additional warming over durations which are included in the 1975-1998 span.
https://wattsupwiththat.com/category/hiatus-in-global-warming/
Another alarmist attempt at rebuttal is that the MWP studies cataloged by co2science.org have been cherry-picked. (Dozens of independently peer-reviewed studies spanning several decades, all cherry-picked? And what about the confirming borehole data? And the other supporting data? Readers can satisfy themselves by searching for credible peer-reviewed MWP temperature studies which support alarmist claims and supposedly were not cataloged by Idso at co2science.org.

But, keep in mind that a few stray conflicting studies will not likely be sufficient to rebut the global, warmer MWP because, as the previous link demonstrates, there are a number of regions during 1975-1998 which show no increasing warming.
There is another question regarding the assumptions used in the alarmist computer models. The greenhouse gas theory, if applied to the open atmosphere, carries with it a critical caveat: for the GHG theory to “hold water” there must also be an accompanying warmer region about 10km above the tropics.
Despite decades of radiosondes that “hot spot” has never been found, and this is not a matter of missing data. The radiosonde temperature data covers various altitudes, both above and below 10km.
Occasionally some proponent of anthropogenic catastrophic warming claims to have found that required and missing “hot spot”. (Alarmists apparently do not otherwise bring up that subject.) But the folks making such a claim stretch their credibility beyond the breaking point by (1) ignoring the existing radiosonde data, and (2) replacing that ignored/denied data with nothing more than speculation about the missing hot spot.
There is yet another issue. The alarmist computer modelers insist on including the water vapor feedback assumption when the applicability of GHG theory to the open atmosphere is itself in question (no “hot spot” detected, also satellites detect heat escaping to space).
Without water vapor feedback, even if one assumes that CO2 is still capable of influencing warming, the potential warming threat is greatly diminished. (But beware: CO2 supposed capability to warm the planet diminishes quickly as its level increases.)
Ironically, the alarmist egregious claims are currently also rebutted by their own computer models, namely the widening difference between computer model projected global temperature and the subsequent actual recorded global temperature. Recently NOAA has also admitted that a significant number of surface station temperature recordings have been influenced more by the urban heat island (UHI) effect than acknowledged. If/when corrected this will exacerbate the already widening discrepancy.
Ref.: https://principia-scientific.org/empirical-evidence-refutes-greenhouse-gas-theory/
Comment:
CO2 doesn’t warm anything, it cools. However, more CO2 means there’s more Oxygen being produced by plants. More CO2 and more Oxygen at the same time means bigger atmosphere, and a bigger atmosphere means 1. More water vapor will be floating around in the atmosphere instead of in the oceans, which means lower sea level, and 2. More water vapor, means it will be able to transport more energy (heat) further towards the poles (more ice will melt).
R. J. L.
