

Image: Life in the freezer: Inside the northernmost city on Earth whose residents endure – 55°C temperatures and two months of total darkness every year
Here at NTZ we are glad to see that German weather and climate blogger Schneefan is back from his hiatus and this week he presents a couple of interesting posts, here and here.
Cold to grip Europe for rest of month
First he writes that the latest weather models and patterns are now pointing to an extended winter this year for Europe. For example the 14-day forecast for Hanovershows frosty conditions ahead.
Also a recent run by the European weather model shows severe cold potentially gripping Europe in 9 days:

February 1°C cooler than normal
So far Germany has seen the first half of February come in almost 1°C cooler than normal, making it among the coldest in years, says meteorologist Dominik Jung of www.wetter.net.
Earlier projection was entirely wrong
According weather experts, March is also expected to be wintry and could be one of the coldest in years. That’s quite a turnaround given that the earlier CFS forecast made back in mid-January which showed blow torch temperatures cooking Europe in February:
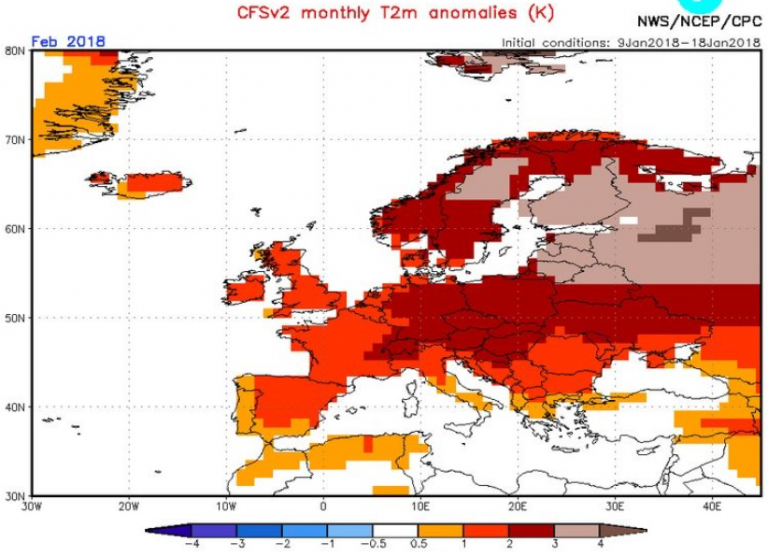
The US National Weather Service (CFS) 2m surface temperature forecast made on 18 January, 2018, showed very warm conditions for February. That forecast has since been drastically revised.
La Nina dragging temperatures down
So why have we been hearing about so many harsh winter conditions all over the northern hemisphere this winter?
One reason likely has something to do with the fact that the globe has been cooling off substantially since the last El Nino ended in 2016. Currently we are now experiencing La Niña conditions:

Chart shows the weekly deviations from the mean for the El Niño-region 3.4 from May 2016 until the beginning of February 2018. Currently we find ourselves in the cool La Nina phase. Source: KNMI
Furthermore, the National Weather Service continues to show La Nina conditions persisting through most of 2018, which means a greater likelihood of a further cooling of the globe’s surface:

Over the past 2 years global surface temperatures as measured by satellites show steady cooling. Source: WoodForTrees.org.
Another longer term culprit suspected of being behind the cooling is the current solar cycle number 24, which has been abnormally weak over the entire current decade. The Cycle 24 was the weakest in 200 years. Low solar activity has been shown to lead to cooling surface temperatures.

Screenshot shows the number of spotless days on the sun up to February 14, 2018. Source: www.spaceweather.com/
Oceans cooling over past 3 years
Another sign that bodes especially ill for continued surface cooling is that the world’s oceans have been cooling. 71% of the earth’s surface is covered by water, which means these temperature changes will have significant impacts on the globe’s climate.
In January 2018 Ron Clutz reported at Science Matters on an unexpected phenomenon: the cooling of the global oceans over the past 3 years:
The chart below shows SST monthly anomalies as reported in HadSST3 starting in 2015 through December 2017.”

After a bump in October the downward temperature trend has strengthened. As will be shown in the analysis below, 0.4C has been the average global anomaly since 1995 and December has now gone lower to 0.325C. NH dropped sharply along with the Tropics. SH held steady erasing the Oct. bump. All parts of the ocean are clearly lower than at any time in the past 3 years.
For Reference:
Global SSTs are the lowest since 3/2013
NH SSTs are the lowest since 3/2014
SH SSTs are the lowest since 1/2012
Tropics SSTs are the lowest since 3/2012[…]
The oceans are driving the warming this century. SSTs took a step up with the 1998 El Nino and have stayed there with help from the North Atlantic, and more recently the Pacific northern “Blob.” The ocean surfaces are releasing a lot of energy, warming the air, but eventually will have a cooling effect. The decline after 1937 was rapid by comparison, so one wonders: How long can the oceans keep this up?”
Read the entire post at Science Matters.
“Bad times” for global warming alarmists
Ron also looks at the AMO ocean cycle. Schneefan summarizes it all in a nutshell:
Everything points to an imminent tipping of the AMO cycle. That’s going to pull global temperatures downward. For Rahmstorf and Co. bad times are starting.”
Ref.: http://notrickszone.com/2018/02/16/europe-facing-coldest-march-in-years-global-surface-temperatures-cool-bad-times-for-warming-alarmists/
……………………………………..
Doubt whether CO2 Emissions Function as the Climate’s Control Knob
During 2017, 485 scientific papers have been published that cast doubt on the position that anthropogenic CO2 emissions function as the climate’s fundamental control knob…or that otherwise question the efficacy of climate models or the related “consensus” positions commonly endorsed by policymakers and mainstream media. Crickets after the information was released.
