

Image: How did Ireland come to be called the Emerald Isle?
By Kirye
As today is St. Patricks Day, it’s a good time to look at Ireland’s annual mean temperatures over the recent decades.
As we recall, global cooling was the scare of the 1970s before global warming became the scare in the 1980s. So since the 1980s, a fair amount of warming must have taken place, right?
No.
Ireland has been cooling
Looking at 6 stations (half at airports!) across the emerald island, we see in fact there’s been a notable cooling over the past 25 years, since 1994:

Data: JMA
Obviously global warming never made it to the island. And yes, it’s mysterious how the Irish media still continue to hysterically warn about warming when temperatures in fact have been falling instead of rising.
The source of the (untampered) plotted data is the Japan Meteorology Agency (JMA). The six datasets were selected because of their data completeness – only a few months of data are missing.
30 years of cooling
The non-warming trend of the 6 Irish stations goes back to 1986, i.e. more than 30 years:

Data: JMA
There has not been any warming since 1986, thus surpassing the 30-year mean that is defined as “climate”. We see a similar trend in my home country of Japan.
Cooling since Hansen’s 1988 warnings of warming
When did the Irish cooldown start? After the cold years of 1986 and 1987, the temperature spiked more than 3°C in a single year to 11.5°C in 1988, the year that Dr. James Hansen told the world before Congress that the planet was heating and would heat up to unbearable conditions within 30 years.
Plotting the data since Dr. Hansen’s dire warnings in 1988, we see that Ireland in fact has cooled off:

Data: JMA
If the Irish can celebrate anything this St. Patrick’s Day, it is the fact that they won’t need to worry about overheating anytime soon.
Ref.: http://notrickszone.com/2019/03/17/global-warming-leaves-ireland-in-the-cold-emerald-island-has-been-cooling-over-past-3-decades/
Global warming also failed to show up at Austria’s Ischgler Idalpe (Ischgl Idalp).

Fading Warming…More Cooling: Winters At Austria’s Ischgler Idalpe Have Become 1.3°C COLDER Over Past 30 Years!
By Die kalte Sonne
(Text translated by P Gosselin)

New report shows Austrian winters have ignored global warming. Image cropped Zukunft Skisport.
The Austrian Paznaun is a valley in the far west of North Tyrol with an altitude of 900-1800 meters above sea level.
The region thrives on tourism, especially skiing, which generates more than 2 million overnight stays annually. For this reason, hosts and visitors have a special interest in the effects of climate change in Paznaun.
What are the current trends? In November 2018, ski tourism researcher Günther Aigner presented a study in which he closely examined winter trends using the official series of measurements. The pdf of the work can be downloaded free of charge from the web platform “Zukunft Skisport“, where further studies are also available.
Here is the short version of what he found:
The winters in the Paznaun since 1895: An analysis of official winter temperature and snow measurement series
The winters on the Ischgler Idalpe have become colder in the past 30 years. At the ZAMG station (Austrian Central Institute for Meteorology and Geodynamics), winter temperatures fell in a linear trend from minus 4.8 to minus 6.1 degrees Celsius – that is: by 1.3 degrees. Seven of the last ten winters were colder than the 30-year average.
However, no significant winter temperature changes have been observed on the Paznaun mountains for the past 50 years. In discussions about the course of temperatures in relation to winter sports in Tyrol, the choice of time axis is therefore of great importance. The snow measurements at the ZAMG Galtür station over the last 123 years show no statistically significant trends.
Since 1895/96, the annual number of days with natural snow cover has remained statistically unchanged at an average of 173 days. The highest annual snow heights since 1895/96 also show no statistical change and average 114 cm. Their variability is considerable, as the range goes from only 38cm in winter 2016/17 to 210cm in winter 1998/99.
In the ski area “Silvretta Arena” in Ischgl one could ski on 155 days in the average of the last 32 years. The linear trend is rising. Looking at the official measurement data evaluated in this study, the climatological conditions for winter sports in Paznaundie have remained favorable over the last 30 years. No forecasts for the future can be derived from the evaluations published here.”
Ref.: http://notrickszone.com/2019/03/20/fading-warmingmore-cooling-winters-at-austrias-ischgler-idalpe-have-become-1-3c-colder-over-past-30-years/
And, as previously reported a few days ago, global warming also stood up North America
New Study: North America Cooling Since 1998
By Kenneth Richard
The Post-1998 Hiatus Plods On…Regionally. North America (180-0°N, 15-60°N) has been characterized as a “major cooling center” by the authors of a new paper (Gan et al., 2019) published in Earth and Space Science.
The continent warmed from 1982-1998, but a cooling trend since 1998 has nearly wiped out all the previous warming.
Overall, there has been no significant temperature change in North America since 1982.

The warming and cooling trends, especially the daily temperature minimum (Tmin), are well-correlated (r=0.71) with the path of the Atlantic Multidecadal Oscillation (AMO) during 1950-2014, leading the authors to conclude that the temperature trends over this 32-year period are “a result of” natural changes in the AMO.
The Key Role of Atlantic Multidecadal Oscillation in Minimum Temperature Over North America During Global Warming Slowdown
Daily Minimum temperature (Tmin) is an important variable in both global and regional climate changes, and its variability can greatly affect the ecological system. In the early 21st century, warming slowdown is seen over the North Hemisphere and North America is one of the major cooling centers.
In this study, we found that Tmin experienced an obvious decline in North America during warming slowdown period.
Such Tmin decline is closely related to the Atlantic Multidecadal Oscillation (AMO), the correlation between the decadal components of Tmin and AMO reached 0.71 during 1950-2014.
According to composite analysis, the AMO on the positive (negative) phase takes two low-pressure (high-pressure) systems in the northeastern Pacific and the North Atlantic at night, accompanied by cyclonic (anticyclonic) circulations and warm (cold) advection in North America.
Therefore, the analyses conclude that the Tmin decline during warming slowdown period is a result of the synchronous decrease of the AMO. The results emphasize the key role of AMO on the decadal variation of Tmin in North America.

Image Source: Gan et al., 2019
Another new paper renews the global warming “hiatus” debate and documents a 21st-century cooling trend in northern China that also effectively snuffs out the previous decades of warming for the region.
Satellite-based regional warming hiatus in China and its implication
Global warming ‘stalled’ or ‘paused’ for the period 1998–2012, as claimed by the Intergovernmental Panel on Climate Change (IPCC) Fifth Assessment Report (AR5) (IPCC, 2013).
However, the early drafts of IPCC AR5 have no detailed explanation for this “hiatus” since 111 of 114 climate models in the CMIP5 earth system model did not verify this phenomenon. …
In 2017, after a wave of scientific publications and public debate, the climate models as reported in IPCC remain debates, including definitions of “hiatus” and datasets (Medhaug et al., 2017).
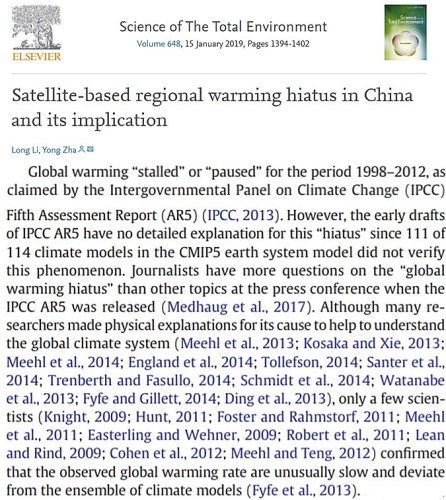
Image Source: Li et al., 2019
The slowdown in global warming since 1998, often termed the global warming hiatus. Reconciling the “hiatus” is a main focus in the 2013 climate change conference.
Accurately characterizing the spatiotemporal trends in surface air temperature (SAT) is helps to better understand the “hiatus” during the period. This article presents a satellite-based regional warming simulation to diagnose the “hiatus” for 2001–2015 in China.
Results show that the rapid warming is mainly in western and southern China, such as Yunnan (mean ± standard deviation: 0.39 ± 0.26 °C (10 yr)−1 ), Tibet (0.22 ± 0.25 °C (10 yr)−1), Taiwan (0.21 ± 0.25 °C (10 yr)−1), and Sichuan (0.19± 0.25 °C (10 yr)−1).
On the contrary, there is a cooling trend by 0.29 ± 0.26 °C (10 yr)−1 in northern China during the recent 15 yr, where a warming rate about 0.38 ± 0.11 °C (10 yr)−1 happened for 1960–2000. Overall, satellite simulation shows that the warming rate is reduced to −0.02 °C (10 yr)−1.
The changes in underlying surface, Earth’s orbit, solar radiation and atmospheric counter radiation (USEOSRACR) cause China’s temperature rise about 0.02 °C (10 yr)−1. A combination of greenhouse gases (GHGs) and other natural forcing (ONAT, predominately volcanic activity, and atmosphere and ocean circulation) explain another part of temperature trend by approximately −0.04 °C (10 yr)−1.
We conclude that there is a regional warming hiatus, a pause or a slowdown in China, and imply that GHGs-induced warming is suppressed by ONAT [other natural forcing] in the early 21st century.

Image Source: Li et al., 2019
Read more at No Tricks Zone
Via https://principia-scientific.org/new-study-north-america-cooling-since-1998/
That’s not all:
From 2012
Uncorrupted US Temperature Data Showed Cooling From 1930 To 1999


