

By Polar Bear Science
Abundant ice in Svalbard, East Greenland and the Labrador Sea is excellent news for the spring feeding season ahead because this is when bears truly need the presence of ice for hunting and mating. As far as I can tell, sea ice has not reached Bear Island, Norway at this time of year since 2010 but this year ice moved down to the island on 3 March and has been there ever since. This may mean we’ll be getting reports of polar bear sightings from the meteorological station there, so stay tuned.
Sea ice extent as of 11 March 2019, from NSIDC Masie:
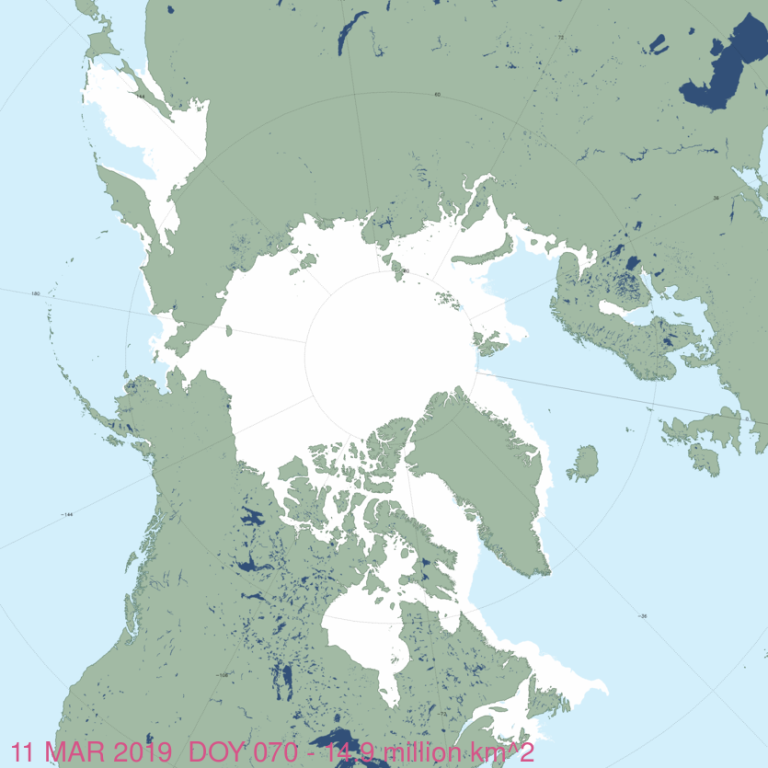
Much of the ice that was blown out of the Bering Sea early in the month has returned and ice in the Gulf of St. Lawrence on the East Coast of Canada is the highest its been in years, threatening to impede ferry traffic between Nova Scotia and Newfoundland, as it did in 2015 and again in 2017. The fishing season off Newfoundland might also be delayed by the heavy ice, as it was in 2017.
BERING SEA
From late February to early March, sea ice retreated from the Bering Sea in such a hurry you could almost see it leave. At the same time, ice increased in the Barents Sea. It was almost as if winds were blowing it across the Arctic from west to east. We know that Bering Sea ice extent is always strongly influenced by wind: in fall, ice forms in the Chukchi Sea and gets blown south into the Bering Sea. However, the winds have changed now and much of that ice is back.

Arctic sea ice at 3 March 2019 from the Bering Sea (left) to the Barents Sea (right).

Arctic sea ice at 11 March 2019 from the Bering Sea (left) to the Barents Sea (right).
BARENTS SEA
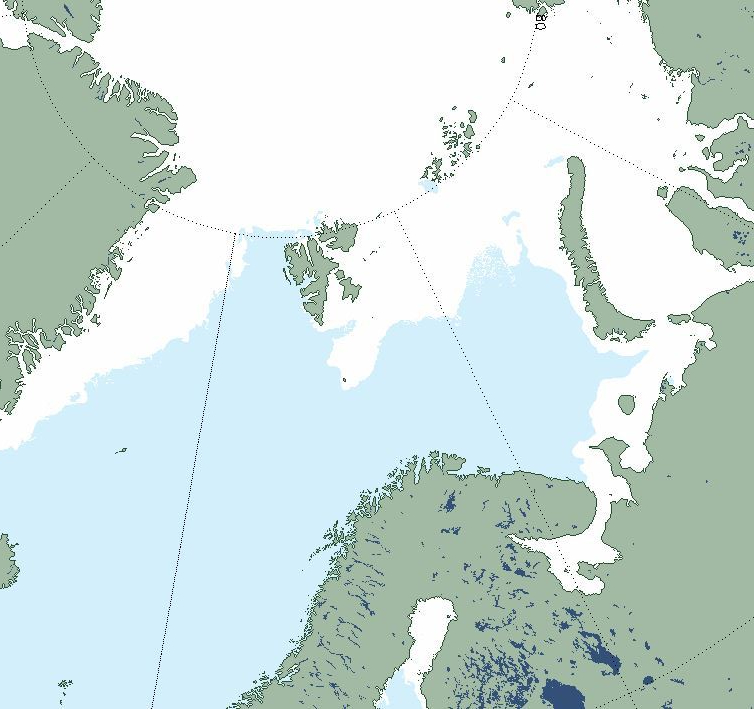
Sea ice at East Greenland, Barents, and Kara Seas at 11 March 2019. NSIDC.
There is still virtually no pack ice on the west coast of Svalbard (below) but that’s been true since about 2007. However, ice off the east coast and to the south is now extensive:

Bear Island, shown in the map below, is the small grey dot in the chart above. Ice reached Bear Island on 3 March and now surrounds it, something that has not happened since 2010:

Svalbard area ice has been up and down all winter but is now well above average:

EAST COAST OF CANADA

From 8 March story from NTV.
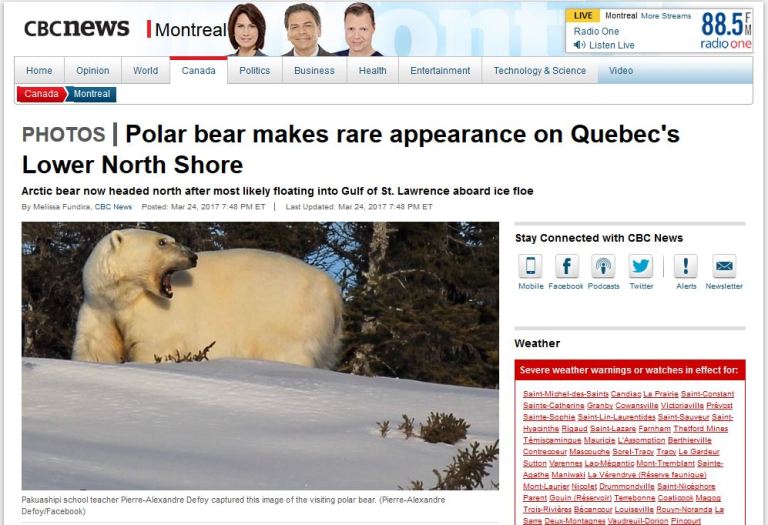
More than average amounts of ice (in blue, below) are present this year on the east coast, although only the ice off Newfoundland is relevant to polar bears, which rarely venture south of the Strait of Belle Isle (although one did in 2017).

Below is the weekly chart for 4 March showing the extent of ice off the East Coast:

Lots of ice off Newfoundland and Labrador in the last two years has resulted in high numbers of sightings of bears ashore, something that did not happen back in the 1980s and 1990s when ice was abundant. That’s because the population size of Davis Strait polar bears had not yet risen to the heights of recent years (which is almost certainly higher than in 2007, when the last survey was done). Even as recently as 2007, when thick ice delayed Newfoundland fishing for months, yet as far as I know there was not a single report of a polar bear ashore. That suggests population numbers must be at a certain threshold before large numbers of bears come ashore in winter and spring.
Ref.: https://polarbearscience.com/2019/03/12/polar-bear-habitat-update-abundant-sea-ice-across-the-arctic-even-in-the-barents-sea/
60 Minutes Softball
Video: Clear Energy Alliance
