

Image: Why Climate Bullies Are Anathema To Science
The secret dishonest climate activists (Rent & Grant Seekers) doesn’t want you to understand; No matter how the atmosphere is changed, it will never be able to warm the surface, and that is actually rather logic if you think about it.
Changes in gravity, mass or pressure, however … but that is not what we’re talking about when it comes to the (Man Made) Global Warming SCAM.
By Paul Homewood

Here is a classic example of how the climate mafia operates:
The World Meteorological Organization (WMO) says that the physical and financial impacts of global warming are accelerating.
Record greenhouse gas levels are driving temperatures to “increasingly dangerous levels”, it says.
Their report comes in the same week as the International Energy Agency (IEA) reported a surge in CO2 in 2018.
However, new data from the UK suggests Britain is bucking the trend with emissions down by 3%.
This year’s State of the Climate report from the WMO is the 25th annual record of the climate.
When it first came out in 1993, carbon dioxide levels were at 357 parts per million (ppm) in the atmosphere. These have now risen to 405.5ppm and are expected to increase further.
This is having a significant impact on temperatures, with 2018 the fourth warmest year on record, almost 1C above what they were in the period between 1850-1900. […snip…]
2018 Climate impacts
-
- According to the report, most of the natural hazards that affected nearly 62 million people in 2018 were associated with extreme weather and climate events.
- Some 35 million people were hit by floods.
- Hurricane Florence and Hurricane Michael were just two of 14 “billion dollar disasters” in 2018 in the US.
- Super Typhoon Mangkhut affected 2.4 million people in and killed 134, mainly in the Philippines.
- More than 1,600 deaths were linked to heat waves and wildfires in Europe, Japan, and the US.
- Kerala in India suffered the heaviest rainfall and worst flooding in nearly a century
The head of the WMO says that the signals of warming continue to be seen in events since the turn of the year.
“Extreme weather has continued in early 2019, most recently with Tropical Cyclone Idai, which caused devastating floods and tragic loss of life in Mozambique, Zimbabwe, and Malawi. It may turn out to be one of the deadliest weather-related disasters to hit the southern hemisphere,” said WMO Secretary-General Petteri Taalas.
Read in full at BBC
The WMO was at the heart of the global warming scam when it began in the 1970s. Every year they publish propaganda reports like this, which the likes of Matt McGrath dutifully report as gospel truth, without any attempt to challenge.
This year the WMO has picked a few weather events and used a thoroughly meaningless sea level rise statistic to pretend that the global impacts of climate change are accelerating.
First that claim of a sea level rise of 3.7mm during the year.
Even the people who measure sea levels say that one year’s data is meaningless. For instance, AVISO states:
…for scientific and statistical reasons, a period under 5 years [is] not significant…
Sea levels fluctuate from year to year for perfectly natural reasons, such as ENSO changes. In addition, the error margins are huge.
Proper oceanographers maintain that sea levels should be measured over decades and not years. For instance, Bruce Douglas:
It is well established that sea level trends obtained from tide gauge records shorter than about 50-60 years are corrupted by interdecadal sea level variation.
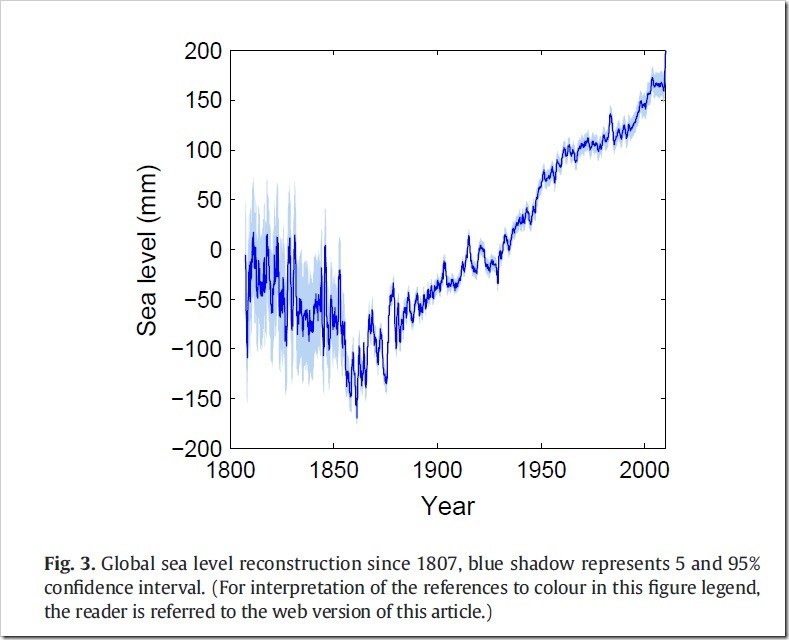
What we do know is that evidence from tide gauges around the world clearly shows sea levels have been steadily rising since the late 19thC, as the world has recovered from the Little Ice Age:
https://notalotofpeopleknowthat.files.wordpress.com/2018/05/jevrejevaetal2013gpchange.pdf
Furthermore, the IPCC has acknowledged that:
It is very likely that the mean rate of global averaged sea level rise was 1.7 [1.5 to 1.9] mm/yr between 1901 and 2010 and 3.2 [2.8 to 3.6] mm/yr between 1993 and 2010. Tide gauge and satellite altimeter data are consistent regarding the higher rate during the latter period. It is likely that similarly high rates occurred between 1920 and 1950.
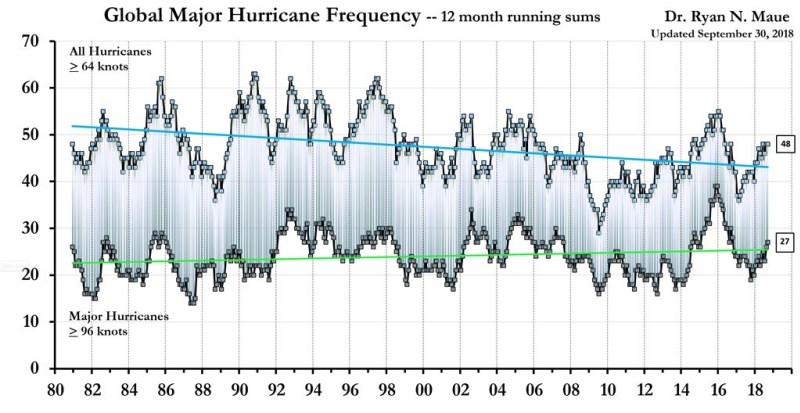
The WMO then goes on to pick out a couple of hurricanes, deliberately ignoring the fact that hurricane activity last year was pretty average:
http://www.policlimate.com/tropical/
As for the floods in Kerala, said to be the worst in nearly a century, one can only ask what caused the ones a century ago!
They even have the nerve to say that Cyclone Idai, which recently hit Mozambique, was a signal of warming that continues to be seen in events since the turn of the year.
Very strange, since hurricane activity in the SH has been relatively subdued in recent years:

http://www.policlimate.com/tropical/
The WMO report is nothing more than the sort of political propaganda you would expect from the UN agency.
Read more at Not A Lot Of People Know That
Via https://principia-scientific.org/climate-mafia-gets-more-unfettered-coverage-at-the-bbc/
Related:
Who Would Counterfeit Data If The Measurements Really Did Show A Problem? – The Leading Data Tampering Excuses
Met Office Try To Hide Forecast Fail – Who would alter (counterfeit) important data if the measurements really did show a problem?
For Some Reason, Winter In The Northern Hemisphere Always Coincide With Summer “Down Under” (Do Not Tell Alarmists Why That Is!) And Due To Counterfeited Data By BoM We Are Secured Yearly High Temperature Records
Who would counterfeit data if the real world, empirical observations really, really did show there’s problems??
Time To Review The Evidence For Man-Made Global Warming
German News Weekly ‘Der Spiegel’ Caught Making Up Another Story, Claimed Bering Strait “Almost Ice Free”


