The Knockout Punch

Image: Now, That’s a Timeline

By Tony Heller

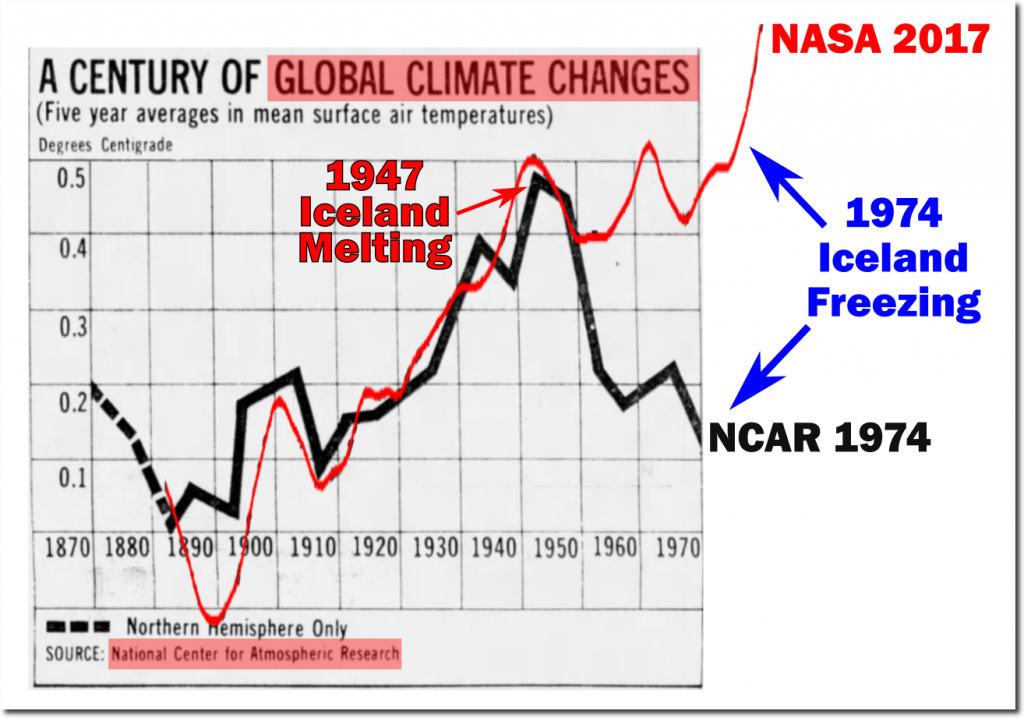
In this video I do a simple experiment which demonstrates that NASA’s global temperature graph does not accurately represent Earth’s temperature history.


But there’s more, over the last 3 years:

Major Greenland Glacier Is Growing

‘A surprise:’ One of Earth’s fastest-shrinking glaciers is suddenly growing again

THE NPS REMOVES ALL “GLACIERS GONE BY 2020” SIGNS AT GLACIER NATIONAL PARK, MONTANA AFTER “LARGER-THAN-AVERAGE SNOWFALL OVER SEVERAL WINTERS”

JUST COUNT THE COLD RECORDS THAT FELL OVER THE PAST 24 HOURS!

Put it all together, is it more likely the earth is warming or cooling?

Why would they need to alter (counterfeit) data if what they actually are measuring shows there’s a problem??

What is logic?


Support

Newscats – on Patreon or Payoneer ID: 55968469

Cherry May Timbol – Independent Reporter
Contact Cherry at: cherrymtimbol@newscats.org or timbolcherrymay@gmail.com
Support Cherry May directly at: https://www.patreon.com/cherrymtimbol

Ad

Why do CO2 lag behind temperature?

71% of the earth is covered by ocean, water is a 1000 times denser than air and the mass of the oceans are 360 times that of the atmosphere, small temperature changes in the oceans doesn’t only modulate air temperature, but it also affect the CO2 level according to Henry’s Law.

The reason it is called “Law” is because it has been “proven”!

“.. scientific laws describe phenomena that the scientific community has found to be provably true ..”

That means, the graph proves CO2 do not control temperature, that again proves (Man Made) Global Warming, now called “Climate Change” due to lack of … Warming is – again – debunked!