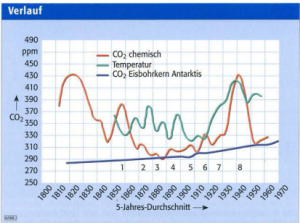
Image: CO2: Ice Cores vs. Plant Stomata
This page introduces Antarctic ice-core records of carbon dioxide (CO2) that now extend back 800,000 years at Dome C and over 400,000 years at the Vostok site. Links are also provided to shorter records from other Antarctic locations. The 2000-year record from Law Dome, Antarctica, has been merged with modern records and a spline function was fit to the result to provide a 2000-year time series extending to the present
Contributors
- Dome C 800,000-year record: European Project for Ice Coring in Antarctica (EPICA) members: D., M. Le Floch, B. Bereiter, T. Blunier, J.-M. Barnola, U. Siegenthaler, D. Raynaud, J. Jouzel, H. Fischer, K. Kawamura, and T.F. Stocker.
- Vostok 400,000-plus-year record: J.R.Petit, Laboratoire de Glaciologie et Geophysique de l’Environnement , Grenoble, France
Collective Period of Record
~137 to 795,000 years Before Present (B.P.) (Before year 1950).
Antarctic Ice-Core Stations

Maps of Antarctica showing locations and elevations in meters above sea level (masl) of: Law Dome (66°44’S, 112°50’E, 1390 masl), Dome C (75°06’S, 123°24’E, 3233 masl), Taylor Dome (77°48’S, 158°43’E, 2365 masl), Vostok (78°28’S, 106°52’E, 3500 masl), Dome A (80°22’S, 77°22’E, 4084 masl), the South Pole station (90°S, 2810 masl), and Siple Station (75°55’S, 83°55’W, 1054 masl).
 Graphics
- 800,000-year record from Dome C,
- 400,000-year Vostok Record, and
- 2000-year record from Law Dome, Antarctica.
 Data
Data
- Dome C “800,000-year” EPICA record (796,500 BCE-1813 CE)
- Vostok 400,000-plus-year record (417,400-392 BCE): CDIAC or NOAA
- Law Dome (1- 2006 CE, merged with modern observational data)
- Additional ice-core data found at the World Data Center ice-core gateway
- Additional Data on CDIAC web pages Siple Station: 1734-1983 CE
Methods
At the Bern laboratory, four to six samples of approximately 8 grams from each depth level (0.55m intervals) in the ice core are crushed under vacuum conditions. The sample container is connected to a cold trap for several minutes to release air from the clathrates and the air is then expanded to a measuring cell where a laser measures absorption in a vibration–rotation transition line of the CO2 molecule. Calibration is done using a CO2-in-air standard gas of 251.65 parts per million by volume (ppmv) scaled on the WMO mole fraction scale. At Grenoble (Laboratory of Glaciology, Geophysics and Environment) one to three ice samples of about 40 grams each are crushed under vacuum conditions, and after about 20 minutes the extracted gas is expanded in the sample loop of a gas chromatograph and analyzed. Depending on the amount of extracted air, three to five successive analyses are done. To avoid possible effects of water-vapor interference, the CO2 ratio is calculated as the ratio of the CO2 peak to the air (O2 + N2) peak. Calibration is done using an Air Liquide standard scaled on CSIRO standards (172.8 ppmv, 260.3 ppmv, and 321.1 ppmv). Uncertainty is a few ppmv; measurement error for the Bern laboratory is given in the data file, and the Grenoble Lab generally compares within a few ppmv for the common time interval.
Temporal Uncertainty
Temporal uncertainty of the EPICA 800,000-year series increases with core depth, but estimates indicate that it is usually less than 5% of the true age and is frequently much less than that. The most recent “EDC3” chronology is based on a snow accumulation and mechanical flow model combined with a set of independent age markers along the core, indicating either well-dated paleoclimatic records or insolation variations. See Parrenin et al. (2007) for more detail. The Vostok time scale is based on the the “GT4” chronology, derived in a similar fashion to “EDC3” with age constraints at 110 thousand and at 390 thousand years ago which are assumed to match known events in marine sediments. See Petit et al. (1999) for more detail.
Trends
Over the last 800,000 years atmospheric CO2 levels as indicated by the ice-core data have fluctuated between 170 and 300 parts per million by volume (ppmv), corresponding with conditions of glacial and interglacial periods. The Vostok core indicates very similar trends. Prior to about 450,000 years before present time (BP) atmospheric CO2 levels were always at or below 260 ppmv and reached lowest values, approaching 170 ppmv, between 660,000 and 670,000 years ago. The highest pre-industrial value recorded in 800,000 years of ice-core record was 298.6 ppmv, in the Vostok core, around 330,000 years ago. Atmospheric CO2 levels have increased markedly in industrial times; measurements in year 2010 at Cape Grim Tasmania and the South Pole both indicated values of 386 ppmv, and are currently increasing at about 2 ppmv/year.
References
- Barnola, J.M., D Raynaud, Y.S. Korotkevich, and C. Lorius. 1987. Vostok Ice Core Provides 160,000-year Record of Atmospheric CO2. Nature 329: 408-414.
- EPICA Community Members, 2004. Eight glacial cycles from an Antarctic ice core. Nature 429: 623-628.
- Lüthi, D., M. Le Floch, B. Bereiter, T. Blunier, J.-M. Barnola, et al. 2008. High-resolution carbon dioxide concentration record 650,000-800,000 years before present. Nature 453: 379-382. doi:10.1038/nature06949.
- Petit J.R., Jouzel J., Raynaud D., Barkov N.I., Barnola J.M., et al. 1999, Climate and Atmospheric History of the Past 420,000 years from the Vostok Ice Core, Antarctica, Nature 399: 429-436.
- Parrenin, F., J.-M. Barnola, J. Beer, T. Blunier, E. Castellano, et al. 2007. The EDC3 chronology for the EPICA Dome C ice core. Climate of the Past 3: 485-497.
Citation
EPICA
Lüthi, D., et al. 2008. EPICA Dome C Ice Core 800KYr Carbon Dioxide Data. IGBP PAGES/World Data Center for Paleoclimatology Data Contribution Series # 2008-055. NOAA/NCDC Paleoclimatology Program, Boulder CO, USA. (If accessing the data from this CDIAC site, please add: “accessed from the Carbon Dioxide Information Analysis Center, Oak Ridge National Laboratory, U.S. Department of Energy”).
Also cite the reference to Luthi et al. given above if using the data in any published work.
Vostok
- If accessed from the CDIAC site, see instructions at the bottom of the Vostok web page. If accessed from the World Data Center for Paleoclimatology, see instructions at the top of the page in the “description” file at: ftp://ftp.ncdc.noaa.gov/pub/data/paleo/icecore/antarctica/vostok/readme_petit1999.txt.
- If using the data for a published work, cite the original “original reference” to Petit et al. 1999.
- If using the shorter records of Barnola et al. (1987), cite the paper listed above in the references.
- If using the records of Fisher et al. (1999), the citation directions are given at: ftp://ftp.ncdc.noaa.gov/pub/data/paleo/icecore/antarctica/vostok/readme_vostok_co2.txt.
Other Data Sets
Instructions are given at the bottom of the respective pages for CDIAC data sets. Instructions for the World Data Center material are given in the headers of the data files.
Ref.: http://cdiac.ornl.gov/trends/co2/ice_core_co2.html
Climate Scientist Murry Salby Returns! – Presents NEW SCIENCE
Author of the seminal book on climate; “Physics of the Atmosphere & Climate” Professor Murry Salby is without doubt one of the best Climate Scientists on the planet.
In a lecture in London on the 17th March, 2015, he reveals new work which shows that;
1) The climate sensitivity is below 0.2c – confirmed by 3 independent methods.
2) Most of the observed increase in atmospheric CO2 is not anthropogenic.
3) CO2 movements and concentrations are largely determined by nature, not man; consequently, any cuts we make to our CO2 emissions will not have the desired effect, and are a costly waste of time.
4) CO2, whether man-made or not, does not ‘drive’ the climate system.
Our emissions is not rising anymore:
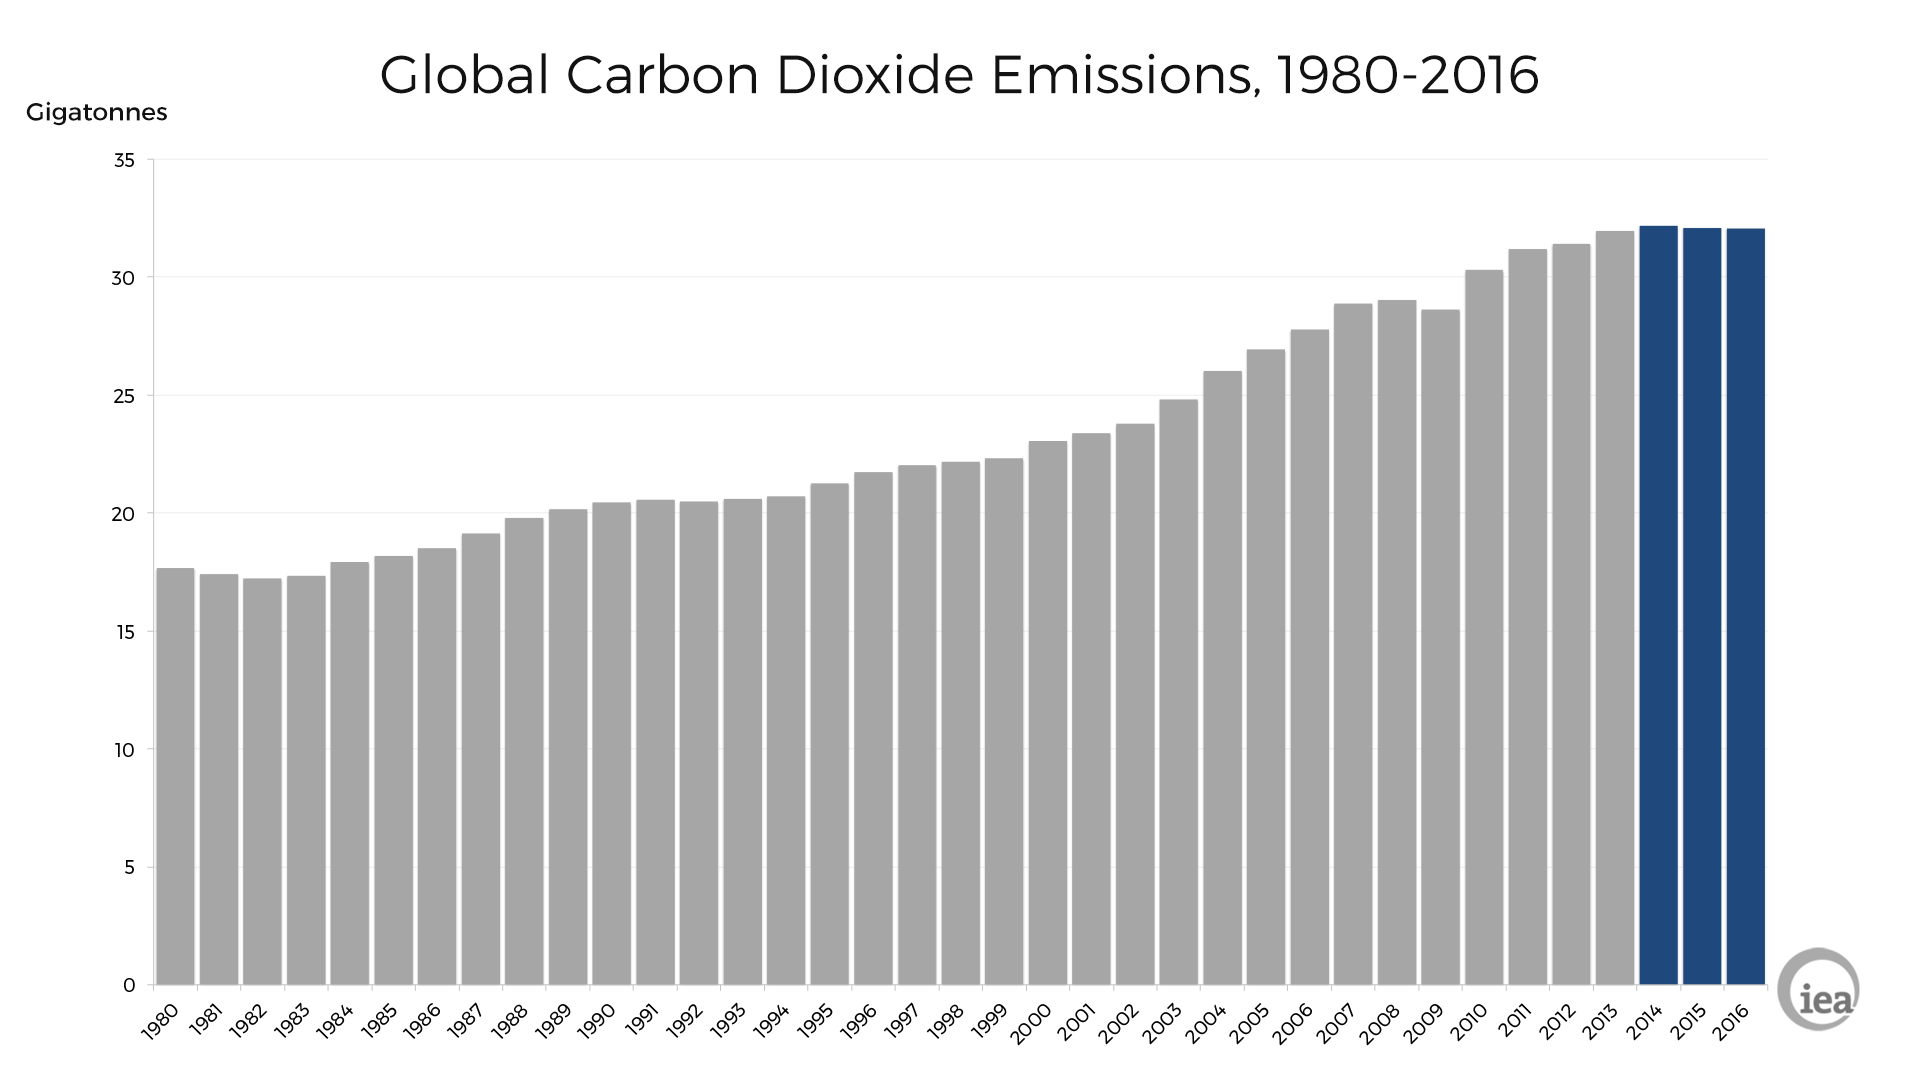
Any increase of CO2., measured at Mauna Loa Observatory over the last three years, has to be explained, if it’s not human emissions causing it, is it another example of fraudulent adjustment of data?
Or is it processes at timescales we don’t fully have accounted for, or even know?

CO2 measured from satellite. If the concentration has been low (historically) over the tropics, where the effect of CO2, in theory, could be having an effect on temperature, what does this picture tell us? Very little CO2 find its way to Antarctica anyway, the Greenland ice-core data is therefor revealing. The CO2 level do fluctuate much more than the alarmists tend to admit and there seem to be support in the data to conclude that CO2 levels has been much higher.