

Image: New study puts a figure on sea-level rise following Antarctic ice shelves’ collapse
Newly published science reveals scientists grossly underestimated the timescales for land uplift in compensating for Western Antarctica ice mass loss, leading them to conclude “the ice sheet may stabilize against catastrophic collapse” (Barletta et al., 2018). Furthermore, even if the most vulnerable ice shelves in the Antarctic Peninsula did collapse completely, the total ice melt contribution to sea level would be negligible – less than 1 centimeter by 2100 (Schannwell et al., 2018).
In recent decades, Antarctic climate trends have not been favoring alarmist perspectives predicated on the assumption that anthropogenic CO2 emissions are catastrophically melting glaciers and contributing heavily to sea level rise.
For example, the ice melt contribution to global sea levels for Antarctica as a whole was about one-third of a centimeter during the 56 years from 1958-2014 (Frederiske et al., 2018).
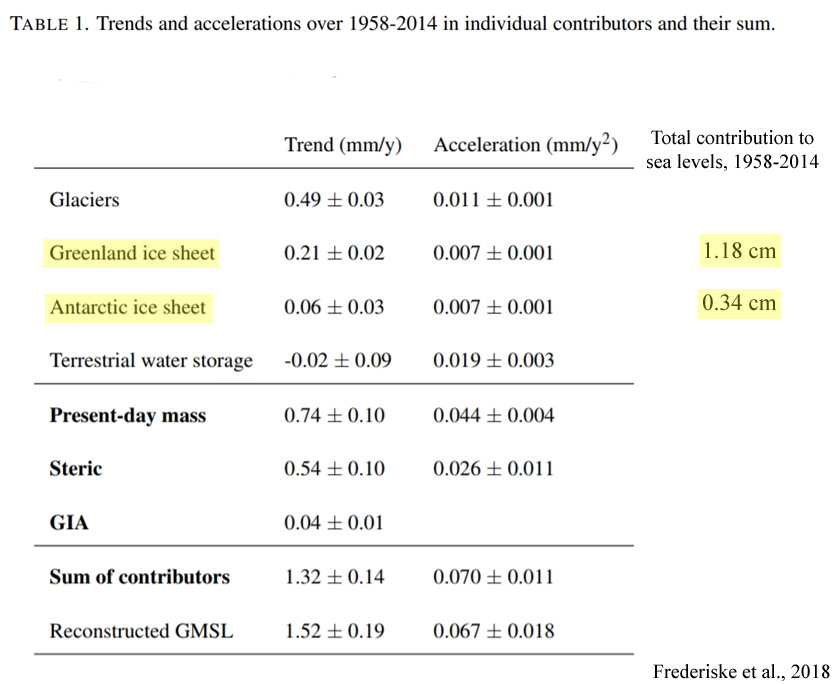
Image Source: Frederiske et al., 2018 (annotations added)
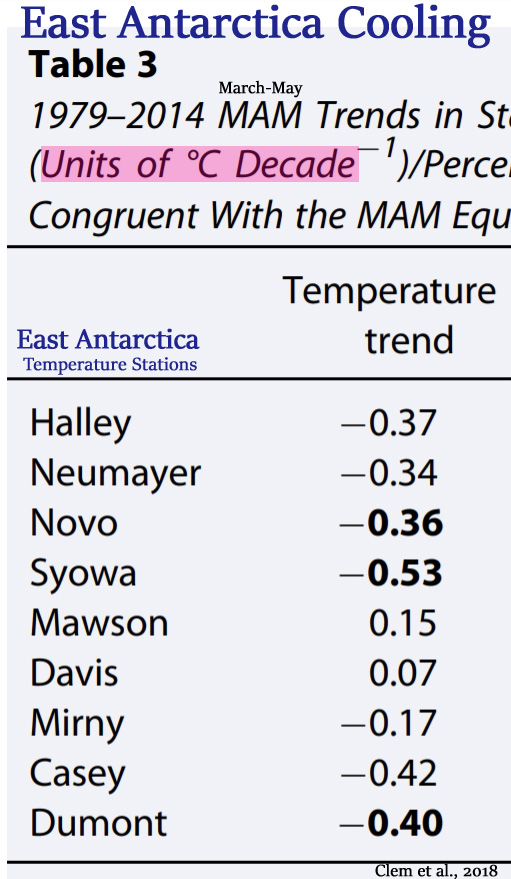
East Antarctica has been cooling (Clem et al., 2018) and gaining ice mass (Martín-Español et al., 2017) in recent decades.
“Over the past 60 years, the climate of East Antarctica cooled while portions of West Antarctica were among the most rapidly warming regions on the planet. The East Antarctic cooling is attributed to a positive trend in the Southern Annular Mode (SAM) and a strengthening of the westerlies, while West Antarctic warming is tied to zonally asymmetric circulation changes forced by the tropics. This study finds recent (post-1979) surface cooling of East Antarctica during austral autumn to also be tied to tropical forcing, namely, an increase in La Niña events. … This enhanced cooling over western East Antarctica is tied more broadly to a zonally asymmetric temperature trend pattern across East Antarctica during autumn that is consistent with a tropically forced Rossby wave rather than a SAM pattern; the positive SAM pattern is associated with ubiquitous cooling across East Antarctica.” (Clem et al., 2018)
“We investigate the mass balance of East Antarctica for 2003–2013 using a Bayesian statistical framework. … We apportion mass trends to SMB and ice dynamics for the EAIS, based on two different assumptions, different remote sensing data and two RCMs. In the first experiment, the model apportions about a third of the mass trend to ice dynamics, +17 Gt/yr, and two thirds, +40 Gt yr−1 to SMB, resulting in a total mass trend for the EAIS [East Antarctic Ice Sheet] of +57 ± 20 Gt yr−1″ (Martín-Español et al., 2017)
The Antarctic Peninsula has been rapidly cooling since 1999 (Turner et al., 2016) at a rate of -0.47°C per decade (Oliva et al., 2017), leading to 10 times smaller ice losses in 2003-2014 than 1995-2003 (Seehaus et al., 2015).
“[A] recent analysis (Turner et al., 2016) has shown that the regionally stacked temperature record for the last three decades has shifted from a warming trend of 0.32 °C/decade during 1979–1997 to a cooling trend of − 0.47 °C/decade during 1999–2014. … This recent cooling has already impacted the cryosphere in the northern AP [Antarctic Peninsula], including slow-down of glacier recession, a shift to surface mass gains of the peripheral glacier and layer of permafrost in northern AP islands.” (Oliva et al., 2017)
“Ice mass loss (2003–2014) was approximately one order of magnitude smaller than between 1995–2003. … The northern Antarctic Peninsula is one of the fastest changing regions on Earth. The disintegration of the Larsen-A Ice Shelf in 1995 caused tributary glaciers to adjust by speeding up, surface lowering, and overall increased ice-mass discharge. … The contribution to sea level rise was estimated to be 18.8±1.8 Gt, corresponding to a 0.052±0.005 mm sea level equivalent [half a centimeter] for the period 1995–2014.” (Seehaus et al., 2015)
Two New Papers Effectively Nix Catastrophic Ice Sheet Collapse Alarmism
Barletta et al. (2018) discover that the West Antarctic bedrock’s rebound response to ice mass losses takes decades, or less than a century. It was previously thought this process would occur “on a time scale of 10,000 years”. This has led them to conclude that “the ice sheet may stabilize against catastrophic collapse”.
Barletta et al., 2018
Observed rapid bedrock uplift in Amundsen Sea
Embayment promotes ice-sheet stability
“The marine portion of the West Antarctic Ice Sheet (WAIS) in the Amundsen Sea Embayment (ASE) accounts for one-fourth of the cryospheric contribution to global sea-level rise and is vulnerable to catastrophic collapse. The bedrock response to ice mass loss, glacial isostatic adjustment (GIA), was thought to occur on a time scale of 10,000 years. We used new GPS measurements, which show a rapid (41 millimeters per year) uplift of the ASE, to estimate the viscosity of the mantle underneath. We found a much lower viscosity (4 × 10¹⁸ pascal-second) than global average, and this shortens the GIA response time scale to decades up to a century. Our finding requires an upward revision of ice mass loss from gravity data of 10% and increases the potential stability of the WAIS against catastrophic collapse. … This means that as ice is lost, the crust rebounds much faster than previously expected. Although estimates of total ice loss have to be revised upward, the surprising finding indicates that the ice sheet may stabilize against catastrophic collapse.”
In another new paper, Schannwell et al. (2018) report that even the total collapse of gigantic Antarctic Peninsula ice shelves (Larsen C and George VI) will contribute less than 1 cm to sea levels by 2100, effectively cancelling proclamations that ice shelf collapse would have catastrophic consequences.
Schannwell et al., 2018
Dynamic response of Antarctic Peninsula Ice Sheet
to potential collapse of Larsen C and George VI ice shelves
“Ice shelf break-up and disintegration events over the past 5 decades have led to speed-up, thinning, and retreat of upstream tributary glaciers and increases to rates of global sea-level rise. The southward progression of these episodes indicates a climatic cause and in turn suggests that the larger Larsen C and George VI ice shelves may undergo a similar collapse in the future. However, the extent to which removal of the Larsen C and George VI ice shelves will affect upstream tributary glaciers and add to global sea levels is unknown. Here we apply numerical ice-sheet models of varying complexity to show that the centennial sea-level commitment of Larsen C embayment glaciers following immediate shelf collapse is low (< 2.5 mm to 2100, < 4.2 mm to 2300). Despite its large size, Larsen C does not provide strong buttressing forces to upstream basins and its collapse does not result in large additional discharge from its tributary glaciers in any of our model scenarios. In contrast, the response of inland glaciers to a collapse of the George VI Ice Shelf may add up to 8mm to global sea levels by 2100and 22mm by 2300 [0.8 cm to 2.2 cm] due in part to the mechanism of marine ice sheet instability. Our results demonstrate the varying and relative importance to sea level of the large Antarctic Peninsula ice shelves considered to present a risk of collapse.“
