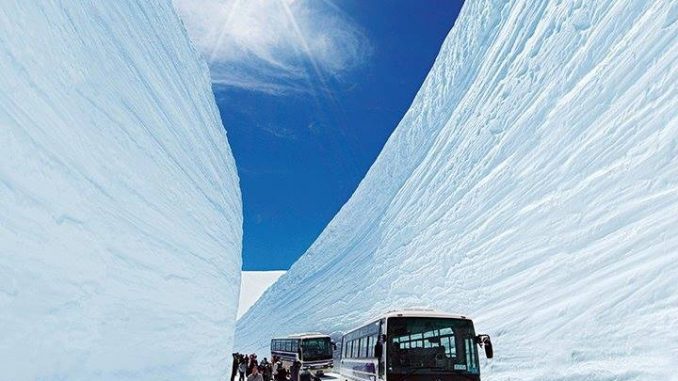
You think we had a bad winter here in the USA? Look at Japan where they have walls of snow 56 feet tall (almost the height of a 6-story building).
There’s an avalanche of tourists coming to the Tateyama to see the walls of snow.
This spectacular mountain route, reopened on Sunday after being closed for five months during the winter, expects to receive a million visitors.
The Tateyama Kurobe Alpin Route is a major tourist attraction in Japan.
These large white walls are located in Murodo, at the highest point of the route at an altitude of 2,450 meters and are known as “yuki no otani”.


It has been a rough winter full of snow all over the northern hemisphere, as this newest NOAA-20 satellite image shows:
With stunning clarity and unsurpassed detail, the newest polar orbiting satellite in the NOAA fleet, NOAA-20, took this image of the North Pole. The satellite passed over this area of the Earth at least 14 times to capture it.

NOAA-20 satellite shares first polar view, captured April 12, 2018
The VIIRS instrument onboard the satellite created this synthesized view of Earth with the North Pole directly in the center of the image. If you look closely, you’ll see the outline of the North American continent and the Baja Peninsula on the left hand side. Scientists use the data from the VIIRS sensor to create the ‘true-color’ product you see here. Like a photograph, the satellite reads the appearance of clouds, land, vegetation and water to create these images.
This is the image we have of our planet as it would appear if we could take a single photograph of the entire Northern Hemisphere. The swath line shown on the left hand side represents the start and end of the 24-hour period taken by the satellite to create the image.
Meanwhile the amount of snow we have in the USA is puny by comparison, but still impressive by Spring standards.
A late season winter storm brought heavy snow across a large part of the region on Wednesday, April 18th with a wide swath of 6 to 12 inches. The heaviest snow fell across northeast Iowa, far southeast Minnesota, and southwest Wisconsin. Snowfall rates of 1 to 2 inches per hour resulted in slick, snow covered roads for many areas.
…Snowfall Reports (5 inches or more)…
Location Amount
…Iowa…
…Allamakee County…
1 SE Dorchester 10.0 in
Harpers Ferry 6.0 in
6 NE Postville 5.5 in
…Chickasaw County…
New Hampton 8.0 in
Nashua 5.5 in
…Clayton County…
Monona WWTP 5.1 in
…Fayette County…
Waucoma 1WNW 5.0 in
…Floyd County…
Charles City 6.6 in
Nora Springs 6.0 in
Nashua 2SW 5.8 in
…Howard County…
Lime Springs 12.5 in
1 NNW Chester 11.0 in
Riceville 11.0 in
Cresco 1NNW 9.5 in
Cresco 1NE 9.0 in
Cresco 3N 9.0 in
…Mitchell County…
Stacyville 12.8 in
Saint Ansgar 11.0 in
2 SE Mona 10.0 in
Osage 8.5 in
…Winneshiek County…
9 NE Bluffton 9.0 in
3 ESE Bluffton 8.8 in
Bluffton 8.0 in
Decorah 7ENE 8.0 in
1 NNE Calmar 6.8 in
Decorah 6.0 in
Decorah 5ESE 5.8 in
…Minnesota…
…Fillmore County…
Harmony 10.0 in
Mabel 7.8 in
Peterson 1S 7.4 in
6 WSW Harmony 6.8 in
Preston 6.5 in
Fillmore 1W 6.5 in
2 E Whalan 5.0 in
…Houston County…
3 SE Spring Grove 10.5 in
4 SE Spring Grove 10.5 in
Caledonia 8.8 in
5 SE Spring Grove 8.0 in
Spring Grove 8.0 in
Hokah 4NW 7.9 in
Mound Prairie 7.2 in
La Crescent 7.0 in
…Mower County…
Le Roy 12.0 in
Adams 10.0 in
1 SW Austin 9.3 in
Taopi 8.5 in
Austin WWTP 8.0 in
Grand Meadow 7.0 in
…Winona County…
La Crescent Dam 7 7.5 in
3 S Ridgeway 5.5 in
Saint Charles 5.5 in
…Wisconsin…
…Crawford County…
1 SSE De Soto 10.0 in
DESOTO 1SE 10.0 in
Lynxville Dam 7.0 in
Prairie Du Chien 6.5 in
…Juneau County…
Union Center 7.5 in
Mauston 1SE 5.0 in
…La Crosse County…
La Crosse 7.3 in
Barre Mills 7.0 in
3 W Saint Joseph 6.5 in
5 SSE La Crosse 6.4 in
5 NNE Stoddard 6.4 in
1 W West Salem 5.8 in
1 SW Saint Joseph 5.5 in
1 N French Island 5.5 in
2 NNW Onalaska 5.3 in
Holmen 2S 5.3 in
…Monroe County…
Cashton 7.0 in
2 NE Sparta 5.8 in
…Richland County…
5 ESE Ithaca 7.0 in
Richland Center 6.8 in
…Vernon County…
Purdy 11.5 in
La Farge 9.5 in
3 SSW Westby 9.5 in
1 NE Genoa 9.5 in
Stoddard 9.3 in
Viroqua 9.2 in
Stoddard 5NNE 9.1 in
Readstown 9.0 in
4 NNE Westby 8.3 in
Coon Valley 2W 8.0 in
3 NE Stoddard 7.8 in
Hillsboro WSW 7.5 in
1 NW Valley 7.5 in
Westby 3ENE 7.2 in
2 NW Viola 7.0 in
3 SW Hillsboro 6.5 in
Ref.: https://wattsupwiththat.com/2018/04/22/its-been-a-bad-winter-all-over-snow-in-japan-56-feet-high/
……..
Third Coldest Start To April In The Past 110 Years
The first half of April was third coldest in the past 110 years in the US, and the coldest since 1975. The three warmest first fifteen days of April occurred in 1910, 1930 and 1925 when about 80% of days were over 60 degrees.


Read more at Real Climate Science


