

Image: Bill Nye’s Latest Climate Warning: The US Will Have To Grow its Food in Canada
By Anthony Watts
There has been almost a death watch going on for Chicago, looking for an all time new all-time low temperature record to beat the previous -27°F. For those wishing for a new datapoint, Chicago didn’t beat the all time record, but did set a new record for the day:
The official low temperature at Chicago this morning was -21F. This shatters the previous record for Jan 31st, which was -12F set back 1985. In records that date back to the 1870s, this is only the 15th time Chicago has seen a daily low this cold or colder, yesterday was 14th.
— NWS Chicago (@NWSChicago) January 31, 2019
O’Hare Airport was even colder at -23°F
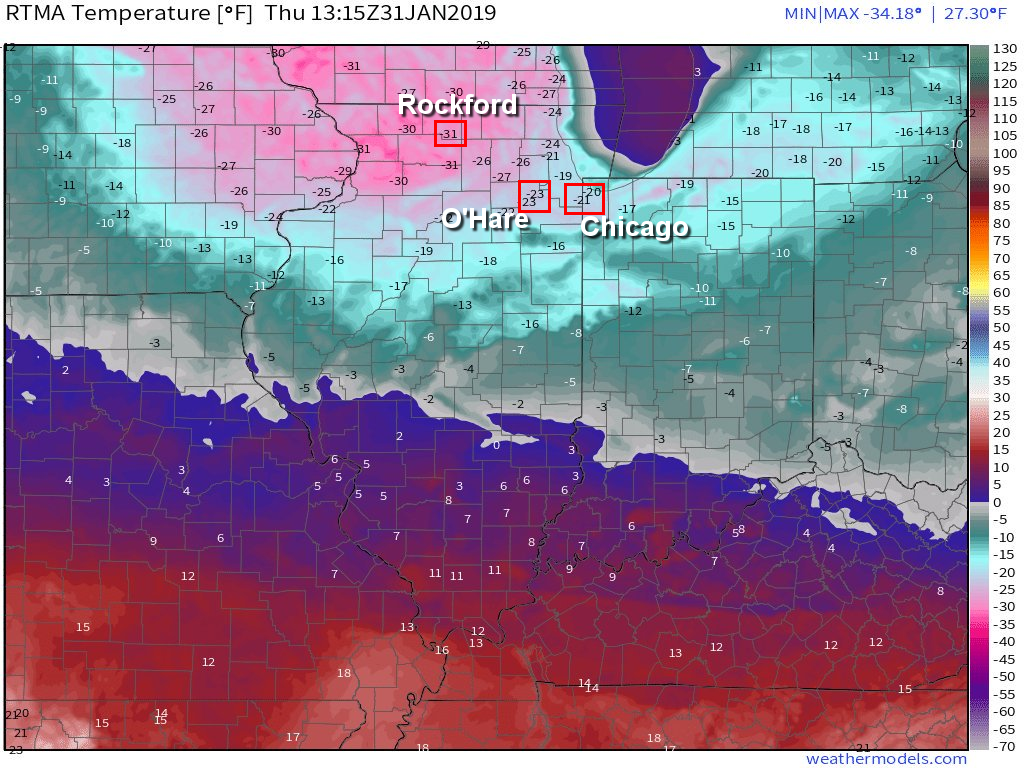
But, not far away, in Rockford, the temperature hit -31°F, exceeding even the NWS announcement a couple of hours ago:
*** All-time Record Low Broken for Rockford ***
With a low temperature of -30°F as of 6:45am this morning, Rockford has broken the all-time record low temperature of -27°F set on 1/10/1982. Records for Rockford date back to 1905. Correction to previous record date.
— NWS Chicago (@NWSChicago) January 31, 2019
Per @NWSQuadCities, -38° was reported in Mount Carroll, Illinois this morning. If accurate, this would set a new Illinois STATE record for low temperature
-56° in Cotton, Minnesota this AM was awfully close to their state record as well pic.twitter.com/gBAqCsyNa0
— Greg Diamond (@gdimeweather) January 31, 2019
A look at the nation shows the depth of the outbreak:
At 7 AM (EST), temperatures bottomed out across the Lower 48 with 84 million people at/below 0°F.
Actually over the next 1.5 hours, over 3.5 million lucky souls experienced at least -30°F (!) in the Midwest. #PolarVortex2019 pic.twitter.com/nQviiuTVAh— Ryan Maue (@RyanMaue) January 31, 2019
In the scheme of things, this cold outbreak ranks with the worst according to Wikipedia references:
The 1936 North American cold wave ranks among the most intense cold waves in the recorded history of North America. The Midwestern United States and the Canadian Prairies were hit the hardest. Only the Southwestern United States and California largely escaped its effects.
February 1936 was the coldest February on record in the contiguous U.S., narrowly eclipsing February 1899.[1] It also was the coldest month ever in Nebraska, North Dakota, and South Dakota.
The meteorological winter (December through February) of 1935/36 was the coldest on record for Iowa,[2] Minnesota,[3] North Dakota,[4] and South Dakota.[5] This winter was much colder than the immediately preceding winters. 1930 through 1934 had very mild winters in the U.S. 1930/31 was warm in the western north central states; 1931/32 in the mid- and south-Atlantic states, the eastern north central states, and the eastern south central states; 1932/33 in New England; and, 1933/34 in the mountain and Pacific states.[6] In the northern plains, the Februaries of 1925, 1926, 1927, 1930, 1931, and 1935 are among the 25 warmest Februaries between 1895 and 2017, although 1929 had the third-coldest February of all-time.[7]
The sea froze partially as far south as Chesapeake Bay.[citation needed] From January 25 to 28, the east had its coldest January temperatures in eighteen years, with Washington, D. C. averaging 14 °F (−10.0 °C)[18] High winds in some locations caused wind chills below −85 °F (−65.0 °C). In Ohio and the Centralia district of Illinois,[19] the cold destroyed the peach crop, whilst defective heaters caused numerous dangerous fires in Minnesota.[18]
The Cold wave of January 1977 produced the only known trace of snow in the greater Miami area of Florida ever reported, although the city itself did not report any snow (a trace of snow was documented in Lake Worth). It occurred following the passage of a strong cold front, in combination with a high-pressure area situated over the Mississippi River Valley. As a result, cold air moved far to the south across Florida, causing both snow flurries and record low temperatures. Most notably, the weather system brought snow flurries (seen in the air, but not on the ground) as far south as Homestead on January 19. No snow had ever been reported in southeastern Florida before or since.
January 1977 is the coldest month on record in the state of Ohio, with an average temperature of 11.9 degrees. Snowfall was above average throughout the month and the all-time record low of −25 °F (−32 °C) was set in Cincinnati. The Ohio River froze solid for the first time since 1918, halting commercial shipping for weeks. Some parts of northern Ohio stayed below freezing for the entire month [10]. Temperatures did not rise above freezing the entire month in a swath from eastern Iowa to western Pennsylvania northward.
