

Russian nuclear icebreaker “Arktika”. By Abarinov (Own work) [Public domain], via Wikimedia Commons
Guest essay by Eric Worrall
h/t 1saveenergy – Two Russian icebreakers have become stuck in metre thick ice fields, on their return from a journey to escort supplies to Russia’s northernmost port.
Icebreakers make historic Arctic voyage, then get stuck in frozen sea on return journey
By The Siberian Times reporter 17 January 2017
Vessels could be marooned ‘for a week’ in East Siberian Sea after getting caught in thick ice.
Bulk carriers Sinegorsk and Johann Mahmastal made a successful midwinter cargo crossing from Arkhangelsk to Russia’s northernmost port of Pevek, Chukotka, escorted by icebreakers Kapitan Dranitsyn and Admiral Makarov.
It was the first such crossing since Soviet times, and the ships delivered supplies for the supplies for the world’s first floating heat and power plant to be assembled in Chukotka after a journey lasting from 14 December to 7 January.
The ease of the sailing is seen as a sign that climate warming in the Arctic can open up shopping lanes even in midwinter. But the climate remains unpredictable as the four vessels have discovered on their return route.
They are currently trapped by sudden thick ice around Chukotka’s northernmost cape Shelagsky, some 24 nautical miles from Pevek, in some of Russia’s most exposed waters.
Ruslan Nazarov, chief of Chukotka’s emergencies service, said: ‘The ice around Cape Shelagsky is at 10 points. The ice fields are more than one metre thick. The ice compression is strong and hummocks are higher than 2.5 metres.
…
Read more (good pictures): http://siberiantimes.com/other/others/news/n0847-icebreakers-make-historic-arctic-voyage-then-get-stuck-in-frozen-sea-on-return-journey/
Its interesting that this crossing hasn’t been attempted since soviet times – perhaps the risk of getting stuck in the ice is too high for this route to be a regular event.
Ref.: https://wattsupwiththat.com/2017/01/19/russian-icebreakers-stuck-in-the-arctic-global-warming/
@NOAA data demonstrates that 2016 was not the ‘hottest year ever’ in the USA
Today, there’s all sorts of caterwauling over the NYT headline by Justin Gillis that made it above the fold in all caps, no less: FOR THIRD YEAR, THE EARTH IN 2016 HIT RECORD HEAT.

I’m truly surprised they didn’t add an exclamation point too. (h/t to Ken Caldiera for the photo)
Much of that “record heat” is based on interpolation of data in the Arctic, such as BEST has done. For example:

But in reality, there’s just not much data at the poles, there is no permanent thermometers at the North pole, since sea ice drifts, is unstable, and melts in the summer as it has for millennia. Weather stations can’t be permanent in the Arctic ocean. So, the data is often interpolated from the nearest land-based thermometers.
To show this, look at how NASA GISS shows data with and without data interpolation to the North pole:
WITH 1200 kilometer interpolation:

WITHOUT 1200 kilometer interpolation:

Here is the polar view:
WITH 1200 kilometer interpolation:

WITHOUT 1200 kilometer interpolation:

Source: https://data.giss.nasa.gov/gistemp/maps/https://data.giss.nasa.gov/gistemp/maps/
Grey areas in the maps indicate missing data.
What a difference that interpolation makes.
So you can see that much of the claims of “global record heat” hinge on interpolating the Arctic temperature data where there is none. For example, look at this map of Global Historical Climatological Network (GHCN) coverage:

As for the Continental USA, which has fantastically dense thermometer coverage as seen above, we were not even close to a record year according to NOAA’s own data. Annotations mine on the NOAA generated image:

- NOAA National Centers for Environmental information, Climate at a Glance: U.S. Time Series, Average Temperature, published January 2017, retrieved on January 19, 2017 from http://www.ncdc.noaa.gov/cag/
That plot was done using NOAA’s own plotter, which you can replicate using the link above. Note that 2012 was warmer than 2016, when we had the last big El Niño. That’s using all of the thermometers in the USA that NOAA manages and utilizes, both good and bad.
What happens if we select the state-of-the-art pristine U.S. Climate Reference Networkdata?
Same answer – 2016 was not a record warm year in the USA, 2012 was:

Interestingly enough, if we plot the monthly USCRN data, we see that sharp cooling in the last datapoint which goes below the zero anomaly line:

Cool times ahead!
Added: In the USCRN annual (January to December) graph above, note that the last three years in the USA were not record high temperature years either.
Added2: AndyG55 adds this analysis and graph in comments
When we graph USCRN with RSS and UAH over the US, we see that USCRN responds slightly more to warming surges.
As it is, the trends for all are basically identical and basically ZERO. (USCRN trend was exactly parallel and with RSS and UAH (all zero trend) before the slight El Nino surge starting mid 2015 )

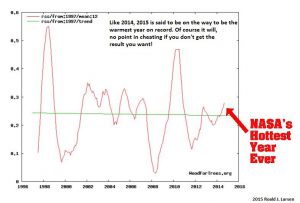
Remember when 2015 was the warmest year on record?
2016 NOT Warmest Year on Record but Davos Elite Push Global Tax & Geoengineering
New headlines claiming that 2016 the warmest ever, but both both RSS and UAH satellite data sets for temperature say its tied with 1998. Look a bit furtehr and the Davos elite are tring to stop populism globally by more wealth distribution which will mainly be funded by a carbon tax. So there it is, the lies of a warming plant continue so a global tax can be instituted.
