

Image: Mauna Loa Volcano, Hawaii.
Updated: According to “direct atmospheric measurements,” CO2 levels were above 400 ppm in the 1940s ..
By Adrian Vance, 2013
The Keeling Fairy Tale
Once upon a time there lived a famous scientist who developed a curve that many applauded and it made him rich and famous. However, some scientists wondered about the Keeling Curve.
It is just too perfect: Experimental science is not like that. Other very serious questions about the Scripps Institute are now pondered, but this is about Dr. Charles David Keeling.
A clever young man who loved the outdoors so much he turned down jobs after getting a Ph.D in physics, where jobs were few as they always have been. He became a post-doctoral student at Cal Tech and there devised a way to measure carbon dioxide claiming it to be more accurate than “wet chemistry.”Gas analysis in chemistry is notoriously difficult: Especially CO2 in air as there is so little of it. Dr. Keeling saw the potential 30 years before Jim Hansen.
Keeling crafted a plan where he could spend his life on Hawaii, making only occasional trips to the posh private dining rooms of San Diego to fund Scripps Institute with billionaire widows hornswaggled into thinking man was destroying Earth and they could save it with ever larger checks. Billionaire widow menopause is a terrible thing to waste.
Scripps found a gold mine by the sea, but it had blue hair and drank bloody Marys. Gas analysis equipment is especially unreliable when examining the atmosphere: “Trace” quantities of CO2 were captured in solutions of sodium hydroxide, then titrated using delicate dyes from flowers to determine quantities chemically. Keeling was not a chemist: He chose to freeze CO2 out of air and measure the volumetric reduction. He used dry ice to chill air running through a tube, then read volume decline to compute the CO2 quantity. An interesting strategy, but…Dr. Keeling used a five liter air sample, 5000 milliliters, ml. The total CO2 volume was only 1.4 ml in 1958, rising to 1.9 ml in 2005. A difference of only 0.5 milliliter.
He claimed to detect year-to-year differences of 0.01 ml with perfect results for 47 years! “Manometer Report III,” the last paper on his method, contains curious statements and claims: “The 1 cc chamber has never been used because equally good results have obtained using the 4 cc chamber,” and mercury manometer meniscus reading magnifiers, he called “telescopes,” claiming scales with the finest graduation of 0.05 mm, but he recorded data a full magnitude, ten times, beyond that point! A 0.05 mm scale is unlikely and 0.005 mm readings he claimed are impossible. If said “1 cc” chamber was never used then how did he know it would not produce better results?
The “cc” leaps from the page as that standard was changed to “ml” in the early 19th century when it was found the official standard block in Paris was flawed and had to be remade. Curious that Dr. Keeling and Dr. Hansen both seem to prefer pre-1832 science to that of the 20th century. And finally, reporting results one full magnitude beyond the capability of your apparatus as perfect is false and original sin in physical science.
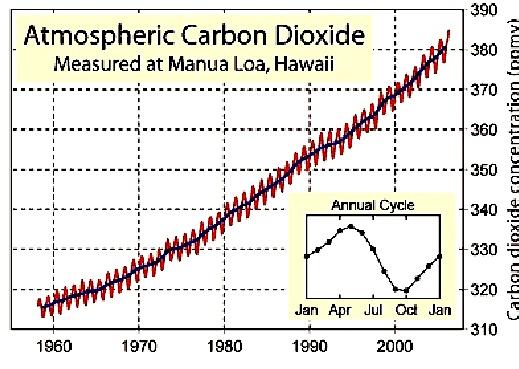
What is even more curious is that Keeling was supported initially by an International Geophysical Year grant in the 50’s and in that work he submitted this graph for the CO2 in the Mona Loa, Hawaii area:
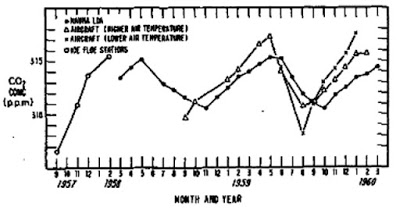
It showed no upward trend so the IGY cancelled his funding. Apparently this awakened Dr. Keeling to the reality of business and money in modern science so he went back to work and in short order began producing results that were of more interest as they fit the apocalyptic hypothesis for panic pushing; new taxes and more bureaus the elected ruling class wanted. Dr. Keeling became rich and famous and he lived happily ever after surfing and eating Dairy Queen ice cream cones every day.
Ref.: https://sciencefrauds.blogspot.com/2013/05/the-keeling-fraud.html
Everything else from and by the left is FAKE, why not a FAKE CO2 graph? In the real world the CO2 level graphs looks very differently, the CO2 level is also much higher without extinction of life, example:


