

It was four months ago that an article entitled 80 Graphs From 58 New (2017) Papers Invalidate Claims Of Unprecedented Global-Scale Modern Warmingappeared on this website. The article received international attention and was “shared” tens of thousands of times.
In the last 4 months, 40 more graphs taken from 30 more new peer-reviewed scientific papers have made their way into the ever-growing volume of evidence that today’s climate is not only not unprecedented or unusual in the context of the last millennium, but modern temperature values are still among the coldest of the last 10,000 years.
In other words, there is nothing unprecedented or unusual about today’s climate. Modern temperatures are still well within range of what has occurred naturally.
The roughly 3 dozen papers and graphs that have appeared in the scientific literature since the original list appeared 4 months ago are shown below.
The full list of 120 graphs from 90 new papers for 2017 can be found here:
‘Global’ Warming Disputed: 350 Graphs
A few late Northern Hemisphere additions to the 2016 volume can also be found below, as well as some recent additions to the list of 350 papers taken from the Ljungqvist (2010) Northern Hemisphere conglomeration.
![]()
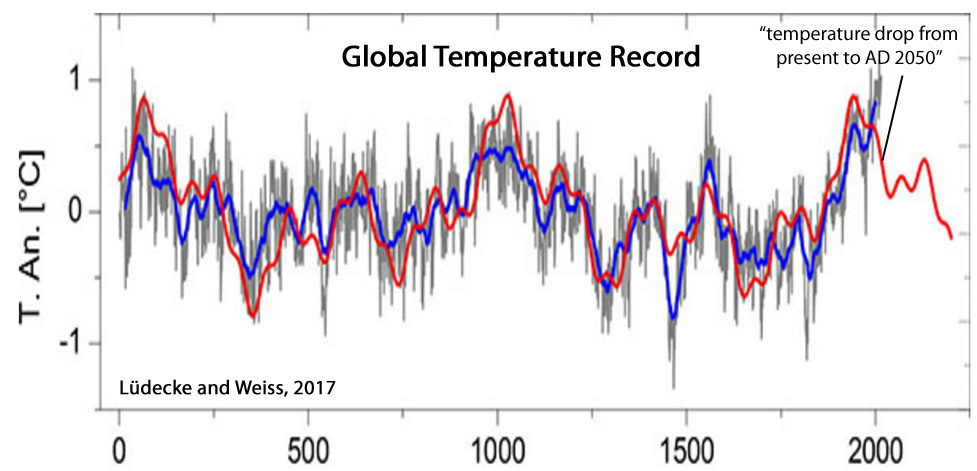
Lüdecke and Weiss, 2017
“By wavelet analysis, a new proof has been provided that at least the ~190-year climate cycle has a solar origin. … G7 [global temperature over the last 2000 years], and likewise the sine representations have maxima of comparable size at AD 0, 1000, and 2000. We note that the temperature increase of the late 19th and 20th century is represented by the harmonic temperature representation, and thus is of pure multiperiodic nature. It can be expected that the periodicity of G7, lasting 2000 years so far, will persist also for the foreseeable future. It predicts a temperature drop from present to AD 2050, a slight rise from 2050 to 2130, and a further drop from AD 2130 to 2200.”
And another example from the article, this from 2016
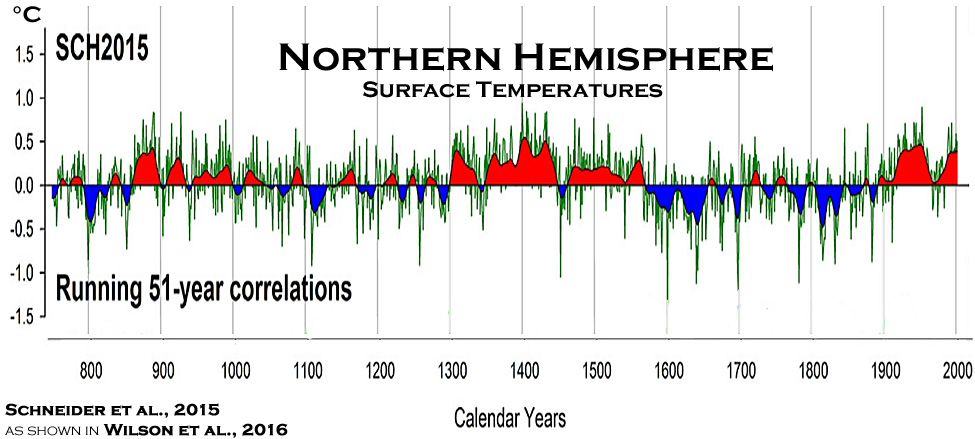
Wilson et al., 2016
Read more at: http://notrickszone.com/2017/09/28/update-the-2017-explosion-of-non-hockey-stick-graphs-continues/#sthash.sY6UUSZP.dpbs
……………………………
What the last graph is showing is how little change there really is.
