

Related: Vancouver has ‘coldest Oct. 10 in 123 years’ as temperatures tumble across B.C.
By Cap Allon – Electroverse
The Grand Solar Minimum has set in across British Columbia, Canada’s westernmost province.
According to Environment Canada, at least 41 all-time low temperature records were busted between Oct 9th and Oct 10th in BC, with more expected to fall as cold air lingers into the weekend.
A meridional jet stream flow, associated with low solar activity, has been diverting masses of Arctic air into the lower latitudes of late. North America is currently taking the brunt, with many central regions now suffering their second HISTORIC SNOWSTORM in as many weeks:
Northern Hemisphere Snow Season off to a Monster Start — More Historic Accumulations on the Way
The sun is fast approaching Solar Minimum of Cycle 24, which will be the deepest minimum of the past 100+ years. The next Solar Cycle (25) is due to begin in 2020/21 and, according to NASA, will be “the weakest of the past 200 years.”
NASA have linked past periods of low solar activity to “extreme drops in temperature,” HERE.
Below I’ve listed British Columbia’s new record low temps from the past 48 hours, and have arranged them by the previous records’ year in an attempt to highlight how neatly low solar activity correlates with record cold.
Compare the years yourself using this sunspot chart:
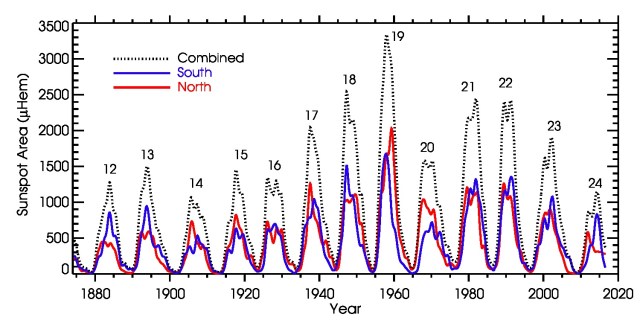
2008/09 (SOLAR MINIMUM OF CYCLE 23):
- Abbotsford: -0.4C (Old record: -0.1C set in 2008)
- Powell River: -1.4C (Old record: -0.3C set in 2008)
- Seschelt: 1.0C (Old record: 2.0C set in 2008)
- Squamish: -1.3C (Old record: 0.9C set in 2008)
- Squamish: -2.2C (Old record of 0.9C set in 2008)
- Squamish Airport: 0.2C (Old record of 0.2C set in 2008) tied
- White Rock: -0.1C (Old record of 2C set in 2008)
- Lytton: -2.3C (Old record: -1.7C set in 2009)
- Clinton: -10.1C (Old record of -8.4C set in 2009)
- Nakusp: -2.7C (Old record of -2.3C set in 2009)
- Williams Lake: -8.0C (Old record of -7.9C set in 2009)
1986-87 + 1975-77 (SOLAR MINIMUMS OF CYCLES 21 + 20):
- Malahat Area: 0.8C (Old record: 3C set in 1987)
- Tatlayoko Lake: -12.4C (Old record of -10.0 set in 1987)
- Whistler: -3.3C (Old record of -3.2 set in 1977)
1923-24 (SOLAR MINIMUM OF CYCLE 15):
- Terrace: -5.5C (Old record of -3.3 set in 1924)
1912-16 (SOLAR MINIMUM OF CYCLE 14):
- Bella Coola: -3.4C (Old record: -3.3C set in 1915)
- Vancouver: -0.7C (Old record: -0.6C set in 1916)
- Port Alberni: -2.7C (Old record: -1.1C set in 1916)
- Port Alberni: -3.4C (Old record of -1.1C set in 1916)
1887/91 (SOLAR MINIMUM OF CYCLE 12):
- Victoria: 0.4C (Old record: 2.2C set in 1890)
Furthermore, the majority of the remaining previous records fell in close proximity to solar minimums.
For the full list of 41 from ECCC, click here.
Ref.: https://electroverse.net/british-columbia-breaks-41-cold-records-in-48-hours/
Related
Tuesday’s Snowfall Beats 118 Year-Old Record At Canadian Rockies Int. Airport
Blizzard warnings for North Dakota
Denver – 2nd Largest Temperature Change On Record!
Early snow and frost stall Canadian harvest
Vancouver Just Suffered Its Coldest October 9th Since 1930
Large winter storm to hit US – In Early October
Record snowfall in Spokane knocks out power, blocks streets
Record cold in Sakhalin Russia
