

Figure 1: Chart depicting Germany September mean temperature over the past 100 years. Data source: DWD.
It’s like CO2 doesn’t work. No, wait, we haven’t emitted any CO2!! Nooo, wait ..
From No Trick Zone
Central Europe Mean September Temperature Shows No Significant Rise Over Past 70 Years!
By Josef Kowatsch and Dr. Sebastian Lüning
(Translated and edited by P Gosselin)
Temperatures are rising and rising and rising. That’s what we read in any case in the daily newspaper, and that’s what some television professors, activists and climate scientists are telling us. Strangely rarely are temperature curves ever shown. Why is this so? One example is the September mean temperature for Germany, which we use to illustrate this peculiar media documentation gap.
Here we use the official DWD German Weather Service data. When we look at the past 100 years we see a very modest warming of just a few tenths of a degree (Fig. 1). This is no surprise as we find ourselves in the warming phase since the Little Ice Age, the coldest phase of the last 10,000 years. It would have been terrible had the climate stayed at this non-representative low level.
It is easy to see the long cycles in the temperature curve. Above we a cold phase between 1920 and 1930, followed by a warm period during the Nazi time, and then followed by a long-term cold dip.
Beginning in 1985, September began to warm up again before reaching a plateau that took hold just before the year 2000 and at which we currently find ourselves. Based on the past development one could speculate that we are headed towards a slight cooling.
Now let’s look at the period from the end of WWII until today, more than 70 years, the time of the last temperature plateau until today. Immediately we see that we are far from worrisome climate warming (Fig. 2):
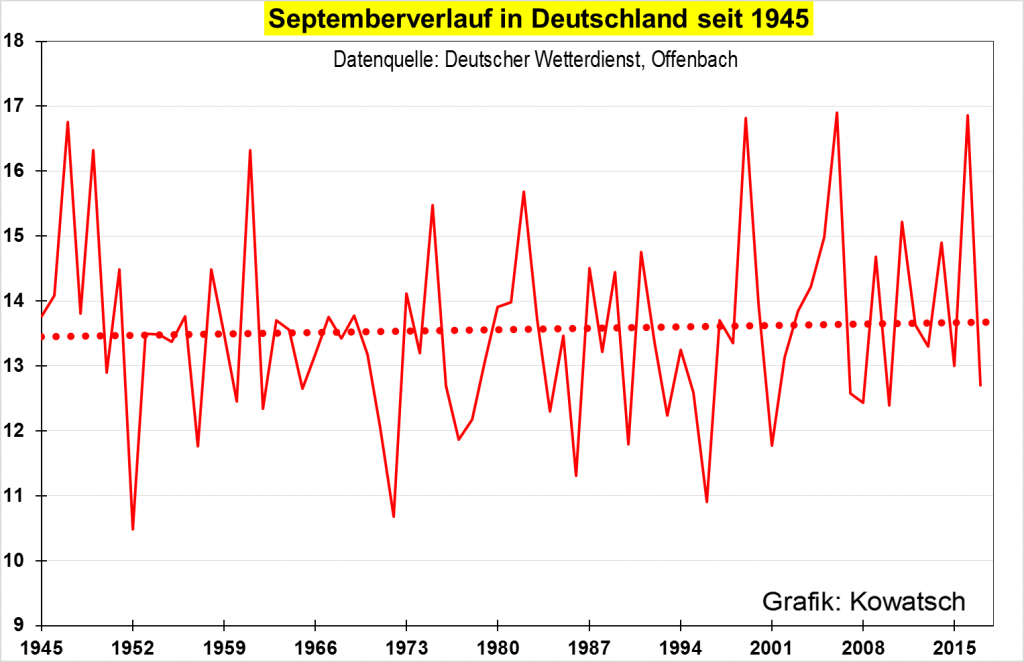
Figure 2: Chart depicting Germany September mean temperature over the past 70 years. Data source: DWD.
Finally we take a look at the past 13 years (Fig. 3), i.e. the development since 2004. Again there has not been any significant warming. In fact there’s been some cooling. Everything other than a climate catastrophe.
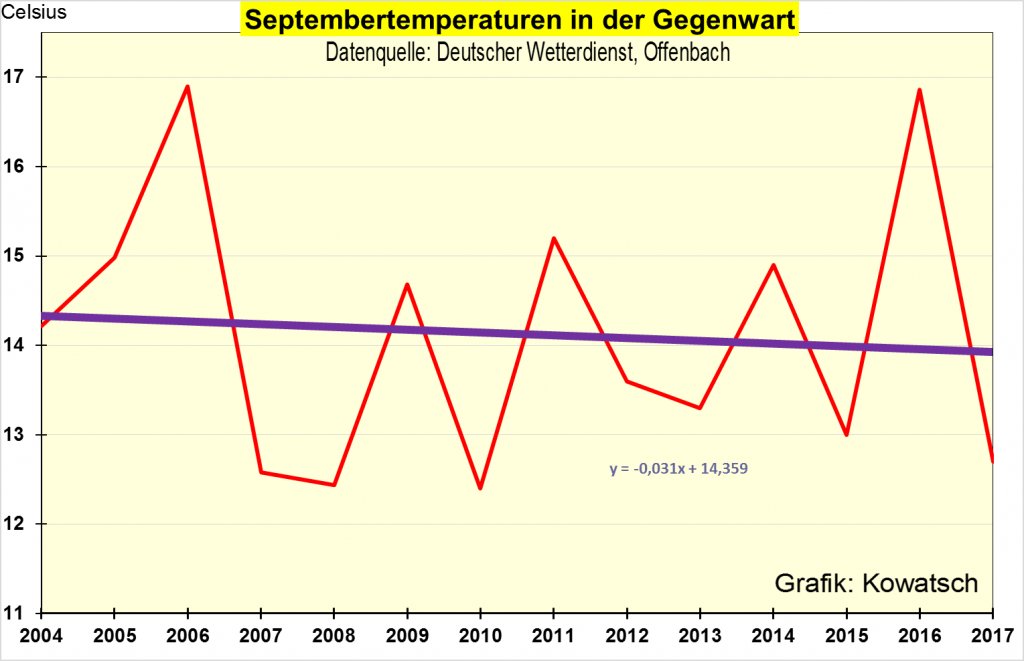
Figure 3: Chart of September mean temperatures in Germany over the past 13 years. Data source: DWD.
Getting back to the primary question of why isn’t the German media showing the real German temperature curve, obviously the real facts are just too inconvenient. A pert of the public could even lose its faith in the much-preached climate catastrophe and end up sharply criticizing the harsh sacrifices now being made because of the climate fear that has been instilled by policymakers.
It’s high time for the issue to be made transparent and to push back against the activism. What’s needed is a new environmental protection ethic, one which addresses all the problems.
The excessive focus on the climate question is no longer sustainable and is even counterproductive. Other more important problems that can be solved over the short term require greater attention — clean water, clean air and clean food being evenly distributed — would be a common ethical goal for mankind to strive for. The fear-mongering climate protection issue is a repeat of the earlier business model of sin and the sale of indulgences.
Ref.: http://notrickszone.com/#sthash.4DSRqLO6.dpbs
Ahhh, here it is
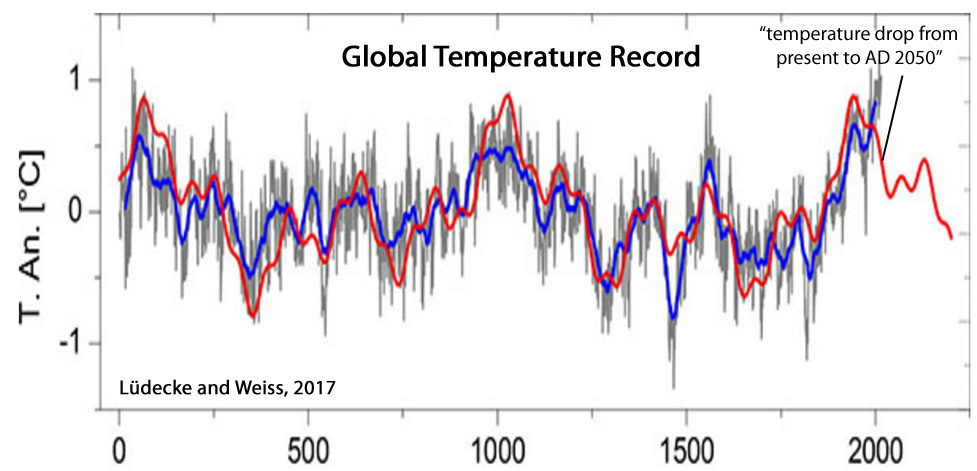
New Paper: Temperature Increase From Doubling CO2 Is ‘Insignificant Compared to Natural Variability’
Engineering Prof. Questions Temperature
Record, Models, CO2 Climate Sensitivity

Photo California Baptist University
Pontius, 2017
Sustainable Infrastructure:
Climate Changes and Carbon Dioxide
Temperatures Record ‘Unreliable’, ‘Arbitrarily Adjusted’, And Of ‘Poor Data Quality’
Temperature measurement stations have been installed at various locations across the globe. The number of temperature monitoring stations is decreasing and many areas across the globe do not have any temperature monitoring stations. Consequently, average surface temperature is an unreliable metric for assessing global temperature trends.
Computer models are used to analyze data sets. In science and engineering (and this paper) the term “data” refers to actual physical measurement at a point in time and space. In some temperature data sets, however, computer simulated values have been added in or data may have been arbitrarily adjusted long after the physical measurement was taken. Such practices undermine the credibility of the data set. Computer generated values are estimates, projections, or simulations and are of a different quality than physical measurements. Physical measurements represent a physical quantity whereas computer simulations represent numerical calculation.
The HADCRU, GISTEMP, and NOAA surface temperature archives rely on the same underlying input data and therefore are not independent data sets. Limitations of the GHCN affect all data sets. Sampling discontinuities, urbanization and land use changes have decreased the quality of GHCN data over time. Differences in data processing methods between research teams do not compensate for poor underlying data quality inherent in the GHCN data. A similar situation exists with historical Sea Surface Temperature (SST) data sets which are derived primarily from the International Comprehensive Ocean-Atmosphere Data Set (ICODADS).
Climate Models ‘Unreliable For Long-Term Climate Prediction’
Computer simulations involve mathematical models implemented on a computer imitating one or more natural processes. Models are based on general theories and fundamental principles, idealizations, approximations, mathematical concepts, metaphors, analogies, facts, and empirical data (Peterson, 2006, Meehl et al., 2012). Judgments and arbitrary choices must be made in model construction to apply fundamental laws to describe turbulent fluid flow. The large size and complexity of the atmosphere prohibit the direct application of general theory.
In general, ensemble model forecasts have been found unreliable for long-term climate prediction (Green and Armstrong, 2007, Mihailović et al., 2014).
“The forecasts in the [IPCC] Report were not the outcome of scientific procedures. In effect, they were the opinions of scientists transformed by mathematics and obscured by complex writing. Research on forecasting has shown that experts’ predictions are not useful in situations involving uncertainly and complexity. We have been unable to identify any scientific forecasts of global warming. Claims that the Earth will get warmer have no more credence than saying that it will get colder.” – Green and Armstrong, 2007.
“This analysis, set into context of the climate modeling, points out the fact that there exists set of domains where the environmental interface temperature cannot be calculated by the physics of currently designed climate models.” – Mihailović et al., 2014
Climate Sensitivity To Changing CO2 Concentrations
Global
The global atmospheric system is dynamic and is constantly in a state of change and adjustment. The sun is the primary climate change driving force.
Using a Climate Sensitivity best estimate of 2°C, the increase in [global] temperature resulting from a doubling of atmospheric CO2 is estimated at approximately 0.009°C/yr which is insignificant compared to natural variability.
CO2 is a non-toxic trace gas constituting approximately 0.04% of the earth’s atmosphere. The global atmospheric concentration of CO2 increased from a pre-industrial value of about 280 ppmv to 379 ppmv in 2005 . The average CO2 concentration at the monitoring station at Mauna Loa, Hawaii for May 2017 is 409.65 ppmv. A rising concentration of atmospheric CO2 will contribute to warming of the Earth’s atmosphere. The physics of CO2 in the atmosphere is very different than the physics of the heating effect occurring in a physical “greenhouse” for growing plants. The term “greenhouse effect” is commonly used to refer to the warming of the earth from “greenhouse” gases such as CO2 in the atmosphere. The term “greenhouse” is not used here to refer to the Earth’s warming to avoid equivocation.
Estimates of climate sensitivity differ widely suggesting that this characteristic of the climate system is not well-understood (Schwartz et al., 2014).
A simple model predicts that a doubling of the CO2 concentration in the atmosphere would result in a small increase of the Earth’s surface temperature, from approximately 0.[5] to < 0.7°C (Kissin, 2015).
“[A] doubling the CO2 concentration in the Earth’s atmosphere would lead to an increase of the surface temperature by about +0.5 to 0.7 °C, hardly an effect calling for immediate drastic changes in the planet’s energy policies.” – Kissin, 2015
A best estimate of 2.0°C (Otto et al., 2013) is assumed here. If CO2 increases at the current rate of approximately 2 ppmv per year, a temperature increase of approximately 0.009°C/yr could be expected.
To date the impact of CO2 is assessed universally within a global reference frame. Although atmospheric CO2 has steadily increased the average satellite global temperatures have flattened since approximately 1995.
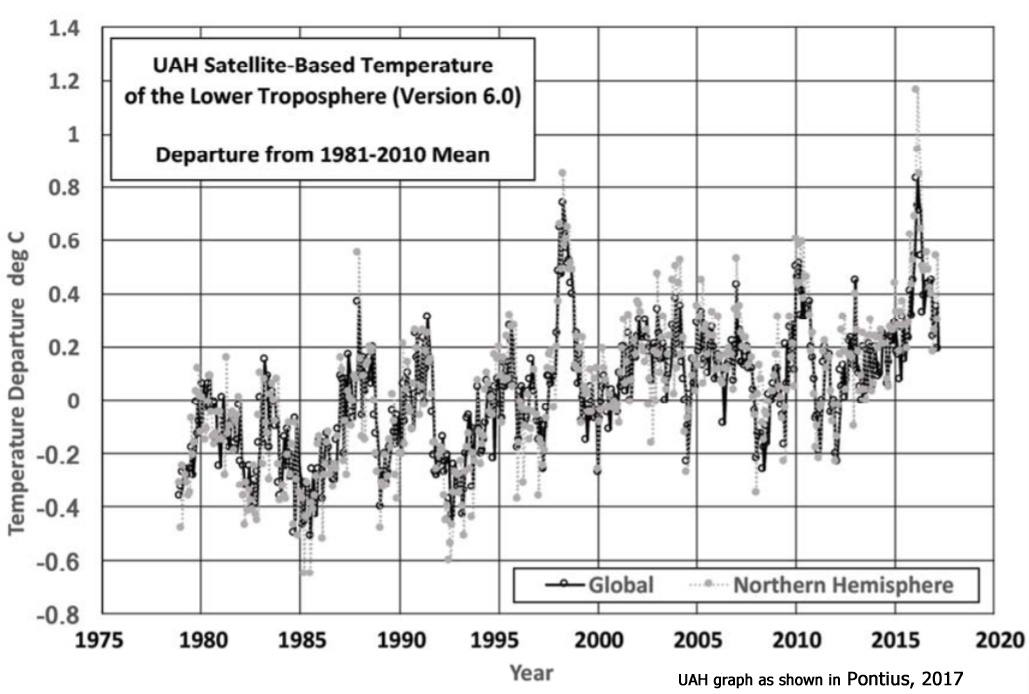
From such trends, it must be inferred that changes in global lower troposphere average temperature correspond to fundamental changes in the climate system beyond internal variability.
Riverside, California
The impact of future atmospheric CO2 warming on the Riverside locational reference frame must be estimated. GCMs [climate models] could be applied to project future global temperatures and those projections could be downscaled to the Riverside area. However, such efforts would be potentially misleading because of the limitations of GCMs discussed previously. Detailed assessments of the CO2 effect have been performed analyzing the Earth’s energy balance in the total atmosphere column and the reduction of the upward infrared radiation emission at the tropopause. The impact of CO2 on warming of the Earth is expressed in terms of “climate sensitivity,” which is the amount of warming that could be expected as a result of doubling of the CO2 concentration.
Available temperature data from both the Riverside Fire Station No. 3 and the Riverside Municipal Airport demonstrate horizontal trends within a wide band of variability. Historical evidence of a significant increase in surface temperatures due to increases in atmospheric CO2 is absent from these data. [C]limate models are useful but limited in their representation of underlying physical processes. Uncertainties and other limitations discussed previously render such models unreliable for long-term global temperatures or local climate change prediction.
Climate sensitivity may be applied to estimate the warming effect of CO2 on the locational reference frame. Factors affecting Climate Sensitivity are not well-understood and estimates differ among researchers. Alternatively, a site-specific model could be developed to estimate the future impact of CO2 warming on a particular location. If atmospheric CO2 continues to increase at its current rate the small annual temperature increase expected at Riverside will likely be insignificant (e.g. < 0.01°C/yr) compared to natural temperature variability.
A slight increase in minimum daily temperature is noticeable at Riverside Fire Station No. 3 after 1998 (Figure 8, lower) with a corresponding slight decrease in the daily temperature range (Figure 9). This trend is most likely due to the urban heat island effect (Tam et al., 2015)resulting from increased development within and around downtown Riverside over this extended period.
