

That is, for 2016, the Temperatures of Earth’s Atmosphere Nearest to Its Surface Were an Insignificant 0.02 Deg C Higher than the Previous El Niño-Related High in 1998.
Guest Post by Bob Tisdale
Earlier this week, Dr. Roy Spencer of the University of Alabama in Huntsville (UAH) announced the annual lower troposphere temperature anomalies for the year 2016. See his post Global Satellites: 2016 not Statistically Warmer than 1998. Bottom line: The UAH global lower troposphere temperature anomaly for 2016 (an strong El Niño-decay year) was only 0.02 deg C (that’s read 2 one-hundredths of one degree Celsius) higher than in 1998, another strong El Niño-decay year with the previous highest value. See Figure 1. (Monthly data here.)
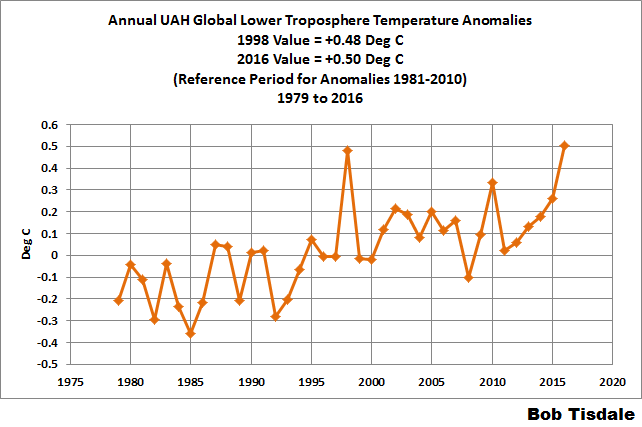
Figure 1
With much less fanfare, Remote Sensing Systems (RSS) released their results for December 2016 yesterday. After converting the monthly data to annual anomalies, we can see that RSS lower troposphere temperature anomalies had similar results. That is, they too showed the RSS global lower troposphere temperature anomaly for 2016 was only 0.02 deg C higher than in 1998. (Monthly data here.) See Figure 2.
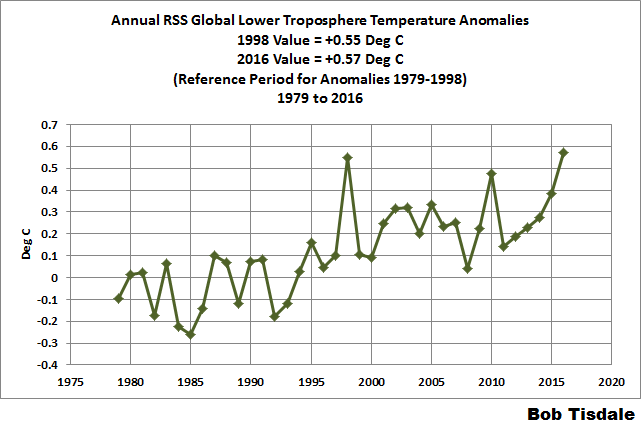
Figure 2
Curiously, in a comparison of two comparably strong El Niño events, even though global lower troposphere temperature anomalies were much lower in 1997 than in 2015 (the El Niño evolution years), they were remarkably similar during the years of 1998 and 2016 (the El Niño decay years). See Figure 3. In other words, the uptick from 2015 to 2016 was much less than the rise from 1997 to 1998, suggesting that the 2015/16 El Niño was weaker than the 1997/98 El Niño.

Figure 3
Another curiosity: the December 2016 and December 1998 values are remarkably similar.
What’ll happen in 2017?

Figure 4
Global lower troposphere temperature anomalies should be lower in 2017 than in 2016 due to the lagged global temperature response to the decay of the 2015/16 El Nino, but the drop will likely not be as significant as the one that happened from 1998 to 1999. Why? See Figure 4. There was a moderately strong La Niña in 1998/99, where weak La Niña to ENSO-neutral conditions exist now.
Summer Snowstorms, Volcanic Dust & Record High Waves
Summer Snows in both Chile and Australia are not normal, this follows records snows in Sapporo and record cold across the Northern Hemisphere. Tallest waves ever recorded and more gigantic volcanic eruptions in Russia’s far east.

