

By Andy May published first on WUWT
Chapter 10 of the 2013 IPCC Working Group 1 Assessment Report (WG1 AR5) report on climate change deals with how man-made climate change is detected and how much of the total change is due to man. They call the chapter “Detection and Attribution of Climate Change: from Global to Regional,” but in the critical calculation they assume the natural contribution is zero, so we consider “man-made” an appropriate addition to the title of this post. In summary, it says that the Earth’s surface has warmed since 1880 and over half of the warming from 1951 to 2010 is due to man. That humans have some influence on climate is not in dispute, all major species have some influence on climate. Phytoplankton occupy most of the Earth’s surface and, since they photosynthesize, they consume CO2 and produce sugars and oxygen. In all probability, they have the largest effect on climate, but we don’t know how much. Humans mostly live in urban areas that occupy 3% of the Earth’s land area and 1.3% of the Earth’s surface. We burn fossil fuels and biomass, producing greenhouse gases (GHGs), that may have some net warming effect on the climate. Some laboratory measurements show a warming effect from CO2and methane, but no measurements have been made in the real world (see pages 883-884 in WG1 AR5).
Using satellite data, we can show that the radiative effect of greenhouse gases, has increased from 1970 to 1997. But, measuring the net surface temperature effect of this increase has proven elusive. For an excellent discussion of the problems of predicting the warming effect of GHG’s see Richard Lindzen’s Remarks on Global Warming. In Lindzen’s remarks he notes that the measurements of global warming that we have are ambiguous regarding man’s GHG emissions and:
“Finally, we must turn to the models. It is from model results that our fear of profound greenhouse warming arises. …doubling CO2 will increase the downward flux at the surface by about 4 Watts/m2/sec; the solar flux in existing models must be adjusted by many times this quantity simply in order to get the present day global temperature correct.”
In the classic paper Lindzen and Choi, 2011, they argue that CERES satellite data suggests that natural feedback to an increase in CO2 is negative. That is, it reduces the temperature increase due to CO2 rather than increasing it as the CMIP5 global climate models predict. So, despite the absence of measurements how has the IPCC separated the warming due to man from natural warming? After all, surface temperatures have been rising since the Little Ice Age which only ended in the late 19th century just as we began to keep track of surface air temperatures worldwide.
According to WG1 AR5, the IPCC chose to run an ensemble of climate computer models using two scenarios, one estimates what would happen with no man-made “climate forcing” and another includes both natural and man-made “climate forcing.” Figure 1 shows how the climate forcings are defined in the models used. The graph shows the assumed effect of each forcing for the period 1951-2010. “GHG” is the effect of well mixed greenhouse gases, “ANT” are the forcings due to man, “OA” are man-made forcings other than greenhouse gases, for example land use changes and aerosol emissions. “NAT” are the assumed natural forcings and “Internal Variability” is the natural variability due to ocean oscillations like ENSO, the Pacific Decadal Oscillation (PDO) and the Atlantic Multidecadal Oscillation (AMO). Natural climate variability is known to be significant, but as you can see in figure 1, the IPCC assumes it is essentially zero over this period. The only natural forcing they investigated is total solar radiation (TSI) variability. There are many estimates of total solar variability in the peer-reviewed literature, but they chose one that showed it to be quite small (see here for a discussion).

Figure 1 (page 66, WG1 AR5)
For a discussion of natural climate variability due to ocean oscillations see here, especially figures 8 and 9. An overall look at natural climate variation can be seen here. The shorter-term ocean oscillations cause climate to vary on a roughly ~60 year period that Wyatt and Curry have called a “Stadium Wave.” Because the IPCC used the period 1951 to 2010 (59 to 60 years) for their computation of man’s influence they may have assumed that the ocean ~60-year variability was the only “Internal Variability” and since their period was approximately 60 years the effective natural variability for the period was zero. I did not see this idea discussed in Chapter 10, but I can see how they could have made that assumption. They do allude to this idea on page 894:
“Climate variability without forcing – called internal variability, such as El Nino-Southern Oscillation (ENSO) fluctuations in the Pacific Ocean, is the dominant source of internal climate variability on decadal to centennial time scales.”
While the quote above from WG1 AR5 only mentions ENSO as an example of natural variability, Wyatt and Curry found that the Atlantic Multidecadal Oscillation (AMO) and the sea ice extent in the European Arctic sea appeared to drive the timing of the overall stadium wave. They also found that the Pacific Decadal Oscillation (PDO) and the Pacific Circulation Index (PCI) are important. On page 885 of WG1 AR5, the IPCC concludes that the “contribution of the AMO to global warming is very small” and that “AMO variability is accounted for in uncertainty estimates.” Most of their reasoning seems to be that the AMO doesn’t fit their computer models, so it can’t be that important. Wyatt and Peters (2012) and others (see Dr. Wyatt’s blog here for a discussion) have looked at CMIP3 and CMIP5 model output for a stadium wave signal and have not found it. This alone, is evidence that the models are not successfully modeling natural variability.
Besides the stadium wave, there are longer and stronger climate oscillations or cycles that have been observed in the geological and historical record, these are discussed here, hereand here. While the evidence for some of the cycles, like the 1000-year Eddy cycle or the 2400-year Bray (Halstatt) cycle is strong, the mechanism behind the cycles is a subject of much debate. Even if the stadium wave could be ignored over a 60-year period, the longer trends may have overlain a secular trend of warming so that the stadium wave does not come back to where it started after ~60 years, but stops at a higher temperature. Thus, the assumption that natural variability is zero, or very close to zero from 1951-2010, may be in error. Since the depths of the Little Ice Age (1300AD to 1750AD or so) the Bray and Eddy cycles have been rising in tandem, see figure 2.

Figure 2 (from Javier, here)
The only natural forcing that the IPCC considered important over the period was the episodic impact of large volcanos. Large volcanic eruptions do have a noticeable effect on climate for a short period, some of the more famous are identified in figure 3. Each of the major volcanic eruptions with a volcanic explosivity index (VEI) of 5 or greater, corresponds with the beginning of a short period of cooler temperatures in all the curves.

Figure 3 (source, Excel spreadsheet here)
In figure 3 we show the natural run data from here, the CMIP5 RCP 2.6 run output from here, the CMIP5 RCP 4.5 output from here and the HadCRU 4.5 temperature record from here. The full spreadsheet with the actual data used to construct figure 3 is here. The CMIP5 data displayed in figure 3 is from the wonderful KNMI climate explorer website maintained by Dr. Geert Jan van Oldenborgh. It is newer and thus different from the data used to make the IPCC WG1 AR5 graphs in figure 4. Figure 3 is also extended through October, 2016 so the impact of the recent El Nino can be seen. The El Nino has taken the HadCRU 4.5 temperatures nearly up to the CMIP5 RCP 2.6 and RCP 4.5 projections. Time will tell if the temperatures will stay that high or not, lately temperatures appear to be falling rapidly.
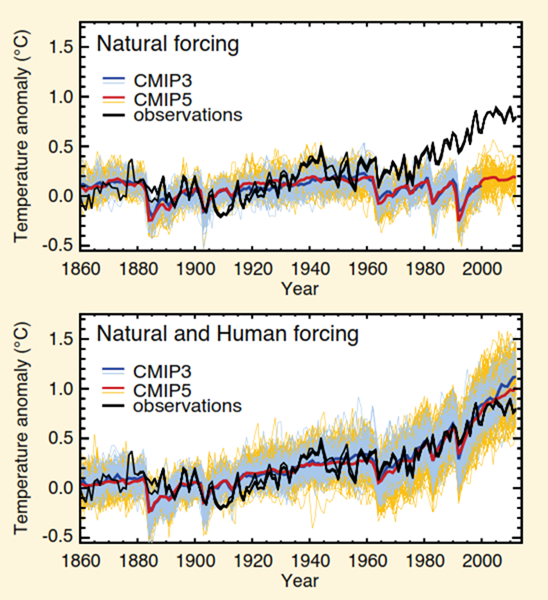
Figure 4 (source WG1 AR5, FAQ 10.1, page 895)
The IPCC computation of man’s influence on climate is based on the difference between the “natural forcing” model results and the “natural and human forcing” model results, then the temperature effect is reduced based on uncertainty computed by the models. No observations or data are involved in the calculation, other than the data used to tune and calibrate the models. As always, we need to observe that the models do not match the natural warming from 1910-1944 or the “hiatus” from 1998 to 2014. This means that 32% of the 156-year record is poorly matched by CMIP5. Thus, at least in my opinion, they are not validated and using them to compute something as important as man’s influence on climate is questionable. The process is explained in WG1 AR5 page 894 as follows:
“Formal climate change attribution studies are carried out using controlled experiments with climate models.”
If the models capture all climate forcings and natural variability the calculation is accurate. If they do not, the calculation is not accurate. In figure 3, the natural curve (blue) drops under the observations (gray) and the two model scenarios (yellow and orange) about 1920. The observations and the model scenarios really take off around 1970. Visually, one would say (assuming the models are correct) that all warming from 1970 to 2010 is due to man. They drop the estimate to “more than half” (page 17) due to uncertainty, they write on page 884 of WG1 AR4:
“Overall there is some evidence that some CMIP5 models have a higher transient response to GHGs and a larger response to other anthropogenic forcings … than the real world (medium confidence).”
As part of their argument and to support their conclusion that man has caused most of the warming they write on page 869:
“The observed global-scale warming since 1951 is large compared to climate model estimates of internal variability on 60-year time scales. The Northern Hemisphere (NH) warming over the same period is far outside the range of any similar length trends in residuals from reconstructions of the past millennium.”
Wow! Talk about blatant and obvious cherry picking. A very similar rapid rise in global temperatures took place just over 1100 years ago during the Medieval Warm Period according to Richard Alley’s central Greenland temperature reconstruction here. Many other reconstructions also show similar dramatic temperature increases over the last 4000 years, see here. In fact, over the last 4000 years there have likely been several warming events similar to the one we are experiencing today in combination with an over-all declining temperature trend since the Holocene Thermal Optimum due to the Earth’s declining obliquity (see Javier’s Figure 9 here).
The IPCC believes that there is evidence man has contributed to the warming of the Arctic and Antarctic. However, the Antarctic, which contains 90% of the world’s ice, is now cooler, contains more ice and the Antarctic sea ice is at a record extent. So, with respect to global warming, this assertion is a non-starter.
The IPCC claims on page 870 of WG1 AR5 that man has made a substantial contribution to upper ocean warming and sea level rise based on computer model results. Sea level has been increasing since the last glacial maximum and it will increase until the next very cold period. Early CSIRO sea level rise data (before about 1960) is very uncertain, the uncertainty is plotted in figure 5 in mm (data from here). After 1960 they estimate an uncertainty below 7 mm as you can see in the graph. From 1960 to 2014 the trend of rise is about 2.2 mm/year (see figure 6), less than the uncertainty in the measurement. From 1880 to 2014 the rise is 1.6 mm/year. From 2000 to 2015 it is 4 mm/year and from 2010 to 2015 it is 2.3 mm/year, both less than the uncertainty. The fluctuations in the rate of sea level rise are tiny and meaningless considering the error of measurement and the short time period. The rate of sea level rise was as much as 10 times the present rate 7000 years ago during the Holocene Thermal Optimum according to a sea level reconstruction by Robert Rohde and according to NASA here.
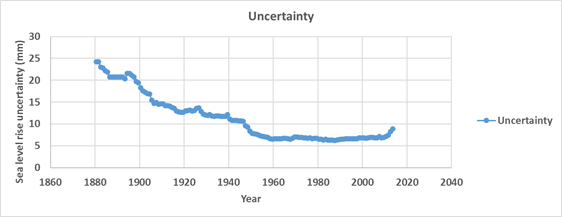
Figure 6
The IPCC summary is:
“From this combined evidence it is virtually certain that human influence has warmed the global climate system.”
OK, most would agree that man has influenced climate by increasing warming to some degree. But, the amount of man’s influence is unknown and unmeasured in nature. Their evidence of the “more than half” claim totally relies on computer models, which they acknowledge might not match the real world. It also relies on their assumptions about internal variability and natural forcings. There is abundant evidence (some cited in WG1 AR5) that both internal variability and natural forcings over the period from 1951 to 2010 are greater than zero. To the credit of the IPCC, they do address some of the uncertainties on pages 881-887. It is this statement on page 60 of WG1 AR5 that appears to be an overreach of the data:
“It is extremely likely that human activities caused more than half the observed increase in GMST [Global Mean Surface Temperature] from 1951 to 2010.”
Their models suggest virtually all the warming over the period is due to man, so they add with uncharacteristic honesty (page 869):
“Uncertainties in forcings and in climate models’ temperature responses to individual forcings and difficulty in distinguishing the patterns of temperature response due to GHGs and other anthropogenic forcings prevent a more precise quantification of the temperature changes attributable to GHGs.”
Then we read the following on page 882:
“Individual model results exhibit considerable spread among scaling factors, with estimates of warming attributable to each forcing sensitive to the model used for the [analysis] …, the period over which the analysis is applied …, and the Empirical Orthogonal Function (EOF) truncation or degree of spatial filtering …. In some cases the GHG response is not detectable in regressions using individual models …, or a residual test is failed …, indicating a poor fit between the simulated response and observed changes. Such cases are probably due largely to errors in the spatio-temporal pattern of responses to forcings simulated in individual models …, although observational error and internal variability errors could also play a role.”
The model ensemble used for attribution is a mean of model results that have a “considerable spread.” Some of the models averaged do not detect a greenhouse effect and some fail statistical tests. The amount of warming attributable to each forcing is different in different models. Yet, the model ensemble mean “looks” better. That is the essence of what they are saying. Not impressive at all. If you torture the data model results enough they will give you the answer you want.
Per a best fit line through the HadCRU 4.5 temperature record (figure 7) global mean temperature increased 0.65° from 1951 to 2010.

Figure 7
The IPCC thinks, based on computer models, that the anthropogenic increase in GHG’s likely caused 0.5°C to 1.3°C (page 869) warming over the period 1951-2010 and that other anthropogenic forcings were causing some cooling. They believe that natural variability and natural forcings are very small. So, if their climate models and assumptions are correct, it is logical to conclude that human activities caused more than half of the warming. We question both the accuracy of their ensemble model mean and their assumptions.
We will close with more of Richard Lindzen’s essay “Some remarks on global warming,” written in 1990 and still true today:
“One can only conclude that the current state of large climate models precludes their credible use in predicting the thermal effects of increasing CO2. … It is easy to see that every suggested policy designed to prevent warming will have almost no effect on warming.”
Ref.: https://wattsupwiththat.com/2016/12/20/detection-and-attribution-of-man-made-climate-change/
